Hear NAB’s senior expert panellists discuss a range of topics to provide key insights to help you and your business prepare for the current property market climate.

While one economic indicator is a statistic about economic activity, a range of economic indicators paint a picture of how the Australian economy is performing. They can also influence interest rates, exchange rates, commodity and stock market prices. Nick Ryder explains them in detail.

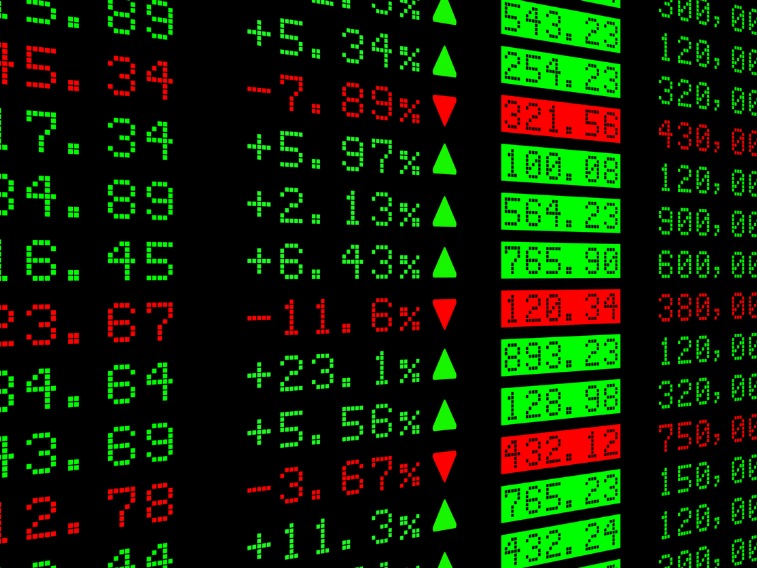
An economic indicator is a statistic about economic activity. Together, a range of economic indicators help paint a picture of how the Australian economy is performing and assists with predictions of future performance.
Examples of key economic indicators include Gross Domestic Product (or GDP), which is a measure of the size of an economy and the Consumer Price Index (CPI), which is a measure for inflation. Other indicators include the unemployment rate, industrial production and retail sales.
Understanding their importance
Economic indicators are important because they can influence interest rates, exchange rates, commodity and stock market prices.
How to use economic indicators
For many economic indicators, market watchers and analysts are more concerned about the change in the number rather than the number itself. For example, GDP in Australia in the three months ending 30 June 2014 was A$397 billion, but this figure was 3.2% higher than the same period in 2013. This showed that the economy grew 3.2% over the past year.
Since some economic indicators are published monthly, we can compare month-on-month (mom) changes (for example, retail sales rose 0.1% over the previous month). While for other indicators which are quarterly, we compare quarter-on-quarter (qoq) or year-on-year (yoy) changes to see how much the indicator moved over their respective timeframes.
Some economic indicators may also be reported on a seasonally-adjusted or trend basis. These are statistical methods for correcting or smoothing data. For example, “seasonally-adjusted” refers to the impact of seasonal cycles on certain indicators, such as the retail sales surge over the Christmas/New Year (Dec-Jan) holiday period. This is adjusted so meaningful comparisons with previous months can be made. Other indicators, such as building permits for apartments, may be very volatile from one month to another, so monthly changes may not be that useful. As such, to strip out the monthly “noise” from the indicator, economists tend to discuss the trend or moving average numbers.
Economic indicators can be broken into three categories based on their timing relative to the business cycle.
For Australian investors, GDP growth and PMI readings in China are important for our mining industry as they can provide signals about future demand for our raw materials, which can in turn impact share prices and exchange rates.
Other indicators relevant in Australia include core inflation (which strips out the impact of volatile items such as fuel prices), business surveys, retail sales and unemployment. They’re all used by the Reserve Bank Board as part of its decision-making process as to whether to change official interest rates.
Hear NAB’s senior expert panellists discuss a range of topics to provide key insights to help you and your business prepare for the current property market climate.
By hedging a share portfolio you can enjoy the upside potential while creating a strategy to limit downside risk
Article
© National Australia Bank Limited. ABN 12 004 044 937 AFSL and Australian Credit Licence 230686.