
Going into an investment clear eyed helps ensure the best outcomes as you build a balanced portfolio capable of performing in a variety of environments.
Investments
1 April 2026
Understanding the yield curve
By Damon Frith, Wealth Editor NAB Private Wealth
The yield curve is one of the most closely watched indicators in global finance. For investors, it acts as a kind of economic seismograph - mapping expectations about growth, inflation, and monetary policy. When the curve inverts, it often signals that something in the economic landscape is shifting and near-term outcomes are uncertain.
What the yield curve measures
At its core, the yield curve plots the interest rates (the 'yields') of government bonds of different maturities at a single point in time. In Australia, this means Commonwealth Government Securities (CGS), ranging from short‑term three‑month bills to long‑dated 10-year and 30-year bonds.
Longer maturities carry more uncertainty, as future inflation, growth, and policy risk are more opaque. Investors typically seek higher yields for longer maturities as compensation for this added risk. This produces the classic upward‑sloping yield curve, where:
• Short‑term yields are lower
• Long‑term yields are higher
This shape reflects a healthy, growing economy where investors expect moderate inflation and stable expansion.
What shapes the curve in Australia
Several forces influence the Australian yield curve:
1. Reserve Bank of Australia (RBA) policy
Short‑term yields move closely with the cash rate. When the RBA tightens policy, short‑dated yields rise quickly.
2. Market expectations
Long‑term yields reflect what investors think the RBA will do in the future, as well as expectations for inflation and growth.
3. Global bond markets
Australia is an open economy. Movements in other markets, but particularly dominant US Treasuries, often spill over into Australian yields.
4. Domestic economic conditions
Employment, wages, commodity prices, and fiscal policy all feed into how investors price risk across the curve.
5. Supply and demand
The Australian market is not as deep as the US market. If billions of dollars of long term Australian treasuries were to be issued there may not be the appetite to digest that easily, leading to a sell-off in that area of the curve.
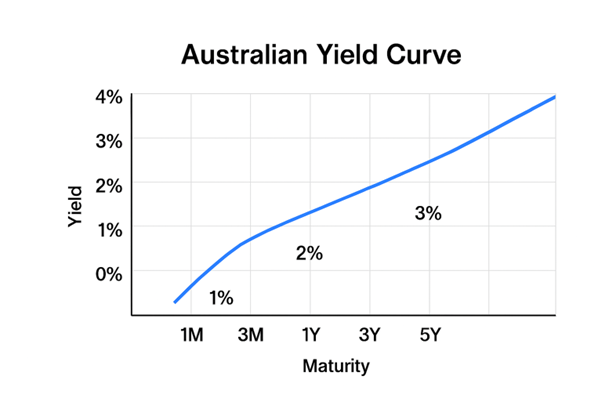
The above graph is a typical representation of the Australian yield curve under normal economic conditions.
- Upward sloping from left to right
- Short-term yields (e.g. 1–3 months) are relatively low
- Longer-term yields (e.g. 5–10+ years) are higher
What this ‘typical’ yield curve means
- Investors expect steady economic growth.
- Inflation is expected to rise gradually over time.
- Borrowing money for longer periods requires higher compensation for inflation and uncertainty.
- Monetary policy is seen as stable, without imminent recession risk.
What is a yield curve inversion?
A yield curve inversion occurs when short‑term yields rise above long‑term yields. In Australia, the most watched spread is the difference between the 10-year and 2-year CGS yields.
An inversion signals that markets typically expect:
• Future growth to slow
• Inflation to fall
• The RBA to eventually cut rates
In other words, investors believe current monetary policy is tight enough to cool the economy significantly.
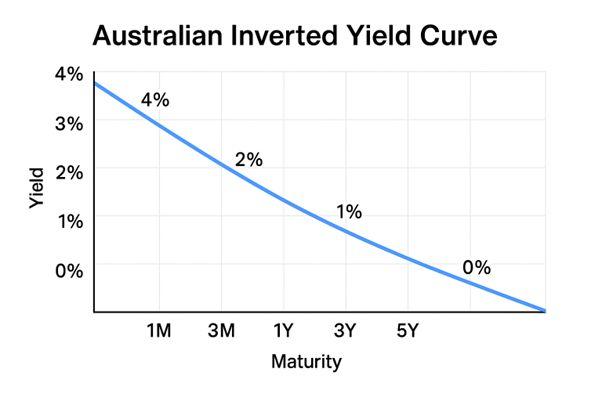
An example of an inverted Australian yield curve.
How to read it
- Short-term yields (1–3 months) are higher
- Long-term yields (5–10 years) are lower
- The curve slopes downward from left to right
What an inverted curve typically signals
- Markets expect economic slowdown or recession
- Investors anticipate future interest rate cuts
- Strong demand for long-term government bonds pushes long-term yields down
- May appear after aggressive RBA tightening
Australian examples of yield curve inversions
Australia has experienced several meaningful yield curve inversions, each occurring during periods of economic stress or transition. While the US curve has a stronger historical track record of predicting recessions, Australia’s inversions have still aligned with major turning points.
1. The Early 1990s Recession (“the recession we had to have”)
When: Late 1989 to early 1990
What happened:
The RBA had aggressively tightened policy to combat high inflation, pushing short‑term rates sharply higher. Long‑term yields, however, began falling as markets anticipated a slowdown.
Outcome:
Australia entered a deep recession in 1990–91. The inversion correctly signalled that monetary policy had become restrictive enough to break inflation - but at the cost of economic contraction.
2. The Global Financial Crisis (2006–2009)
When: Brief inversions in 2006 and again in 2007, the latter shortly before equity markets began to crash.
What happened:
The RBA was raising rates to contain inflation and a booming credit market. Long‑term yields, however, began pricing in the risk of a global downturn as cracks appeared in US housing and credit markets.
Outcome:
The GFC hit in 2008. Australia avoided recession thanks to strong government fiscal support and high commodity demand and prices stemming from China’s domestic stimulus. However, the inversion captured the looming global shock.
The COVID‑19 Shock (2019–2020)
When: Late 2019
What happened:
Even before COVID‑19, global growth was slowing and the RBA had begun cutting rates. Short‑term yields were still elevated relative to collapsing long‑term yields, briefly inverting the curve.
Outcome:
The pandemic triggered the sharpest economic contraction since the 1930s. The inversion reflected global fragility and expectations of emergency monetary easing.
4. The Post‑Pandemic Inflation Cycle (2022–2023)
When: Multiple periods in 2022–23
What happened:
The RBA embarked on its fastest tightening cycle in decades. Short‑term yields surged. Long‑term yields, however, began falling as markets anticipated that aggressive rate hikes would eventually slow the economy.
Outcome:
Growth softened, inflation peaked, and markets priced in future rate cuts. The inversion signalled that policy had moved into restrictive territory.
Conclusion
For investors, the curve helps guide decisions about duration, credit exposure, and currency positioning. For businesses, it offers a forward‑looking signal about borrowing costs and demand conditions.
To discover more call 1300 683 106 or email us on investordesk@nab.com.au
View all Investment Insights and Articles
This article has been prepared by National Australia Bank Limited ABN 12 004 044 937 AFSL and Australian Credit Licence 230686 (NAB) and is intended to be of a general nature only. It does not take into account any person’s objectives, financial situation or needs. Before acting on the information in this article, NAB recommends that you consider whether it is appropriate for your circumstances. NAB Recommends that you seek independent legal, financial, taxation or other professional advice before acting on any information int this article. Information correct as at March 2026.
© 2026 National Australia Bank Limited ABN 12 004 044 937 AFSL and Australian Credit Licence 230686.
Investments

What are real assets and how can they benefit investors?
Insight
Often held as an inflation hedge or source of income, real assets play an important role in an investment portfolio.