Coming in for landing in a heavy cross wind


Insight
The resilience of the US private placements market was evident through 2021 and the indicators for 2022 look even better.
As we finish year two of this challenging environment, markets have matured. At the start of the pandemic, many credit analysts were processing the risk of COVID-19 using unfamiliar data and their own, less analytical, personal experiences. Today, buy side analysts have a radically different view of risk compared with 23 months ago. At the same time, many businesses have demonstrated extreme resilience, while others completely reinvented themselves to adapt to the changing environment.
As it turns out, the world did not slip into a dystopian future, but instead rallied. Early business failures aside, companies continued to function, and today people are even traveling again. Labour shortages, not labour surpluses, are a major issue and people are unleashing pent-up demand on products and services. The two together are causing prices to soar in many parts of the world.
Over the past two years, the US Private Placement Market did what it does in times of crisis – it remained steady. According to NAB data, investors deployed about the same amount of capital in 2021 as they did in pre-pandemic 2019 (circa $100b)1.
Financials and property, which were considered high-risk 23 months earlier, were the top two issuing sectors of 2021 with 22% and 16% of the market respectively2. More importantly, the indicators of market success: tight spreads, “on term” transactions, and investor flexibility were evident throughout most of 2021.
But “more of the same” isn’t an indication of a “big year ahead”.
There are additional indicators that signal an upcoming surge, particularly from Australia and New Zealand.
The first data point is 2021 country specific outcomes by sector. If we look at issuance in two of the stalwart sectors of the private placement market, utilities and property, both were heavily weighted towards US issuers in 2021. Most other sectors saw a more balanced country dispersion. Outside of a small number of transactions from Australia and New Zealand (each led by NAB-sole), the market saw no property activity out of Australasia.
The US Private Placement Market saw global contribution from the property sector of 16%, and 14% from the utility sector. Juxtaposed against 1% of Australian USPP issuance came from the property sector and 0% of Australian from utilities. If we add in New Zealand, the percentage of Australasian issuance for these two sectors was 5% and 9%3. This is still well below the average.
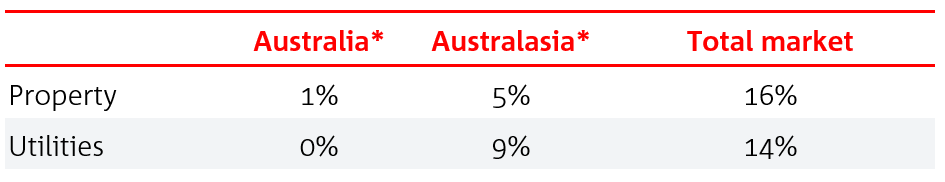
*percentage of regional contribution
Source: Private Placement Monitor, NAB estimates.
Historically, property and utility issuance out of Australia each represented about 18% of total US private placement volume from the region4.
Sector competitors often issue in groups. If we see one port issuing, for example, we can expect to see more right behind this. Conversely, if we see none then it’s a matter of who is willing to go first. If no company goes first, and there is an easily identifiable proof point in another market, this guides the analysis for many corporate issuers.
This is not always the case of course; clients need funding when they need funding, not when their competitors are issuing. However, issuers prefer concrete data points, and there were very little for property and utility issuers in Australia and New Zealand in 2021.
Of note, there were no market forces driving a lack of issuance out of Australasia that didn’t affect other sectors – the AUD/USD basis was the same for all issuers, and credit spreads had retreated to pre-pandemic levels across all industries.
Australian issuance by sector 2019
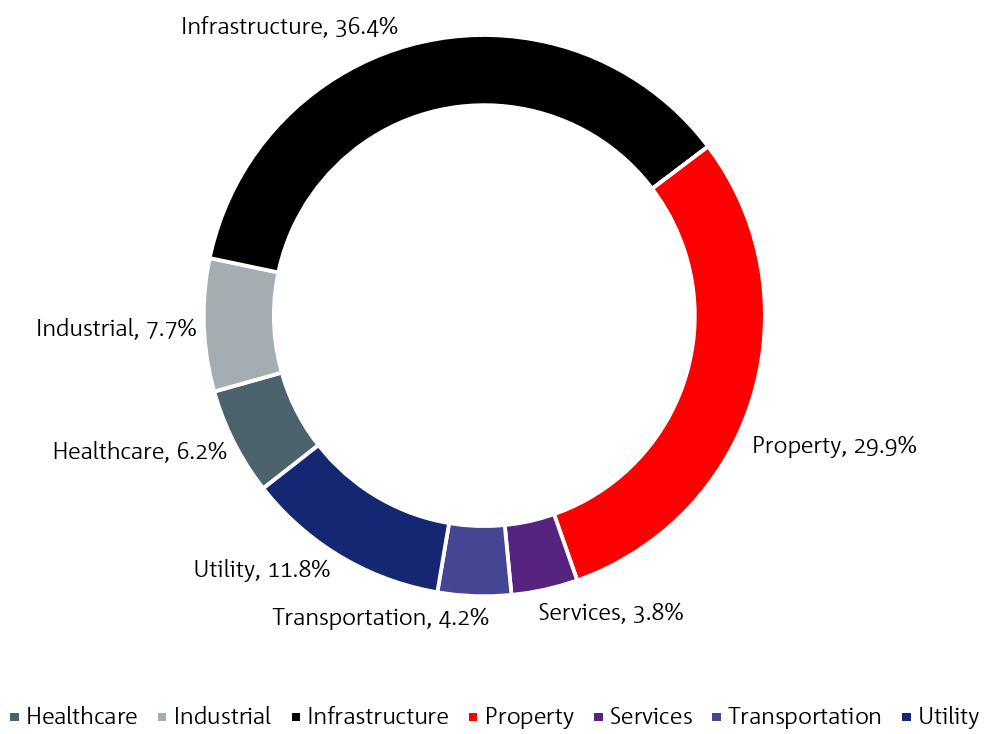
Source: Private Placement Monitor, NAB estimates.
Australian issuance by sector 2021
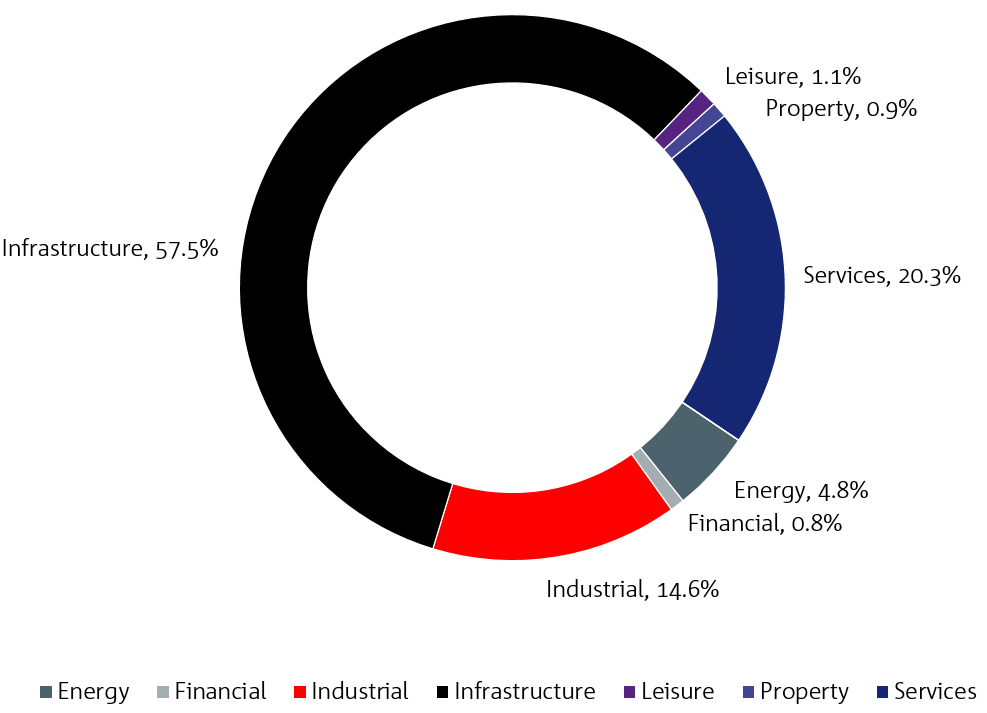
Source: Private Placement Monitor, NAB estimates.
When one looks at the sector contribution by region rather than as a percentage of total market, it’s easy to see where the 2022 opportunity exists. Factors that affect a region should play out equally. If they don’t (as is the case for property and utilities) we can assume there was either no first mover in the prior year, or a temporary condition existed that will correct or has corrected itself.
Aside from supply dynamics, there are also demand dynamics that will support cross border issuers.
The first is corporate bond coupons. Investment firms, primarily life insurance companies in the US Private Placement Market, need yield more than they need spread. Yield pays the returns on annuities and life insurance policies and is an objective outcome of adding Treasury yields and credit spreads together. Spreads on the other hand, measure risk of the investment. Since risk is subjective, credit spreads are often negotiated. Importantly, in an asset-starved environment spreads get negotiated down.
The Federal Reserve Bank has indicated that it is going to raise rates at its next meeting in March and probably two more times after that5. Higher Federal funds rates usually mean higher 10-year Treasury yields.
For US investors this is good news because this translates directly into higher coupons. Conversely, this is not great news for US issuers because their coupons are going up. Importantly, for cross border issuers, the key driver to a higher spread to BBSW or BKBM is credit spread, not coupon. A higher Treasury yield takes the pressure off credit spreads to “make up the difference.”
Lastly, sectors that were off-limits just 23 months ago are back. For example, Sydney Airport’s 2026 bond peaked at T+315 in April of 2020 and is trading at T+70 at the time of writing6. We are seeing similar investment performance across all sectors.
As we look to 2022, we are expecting a big year ahead for Australian and New Zealand issuers, and look forward to speaking to you about raising capital offshore in the US Private Placement Market.
1 Private Placement Monitor, NAB estimates.
2 ibid
3 ibid
4 ibid
5 Federal Reserve Board, NAB estimates
6 Bloomberg data as of January, 2022

Coming in for landing in a heavy cross wind
Insight


Conditions again fell in Q2, but confidence stabilising

Insight
© National Australia Bank Limited. ABN 12 004 044 937 AFSL and Australian Credit Licence 230686.