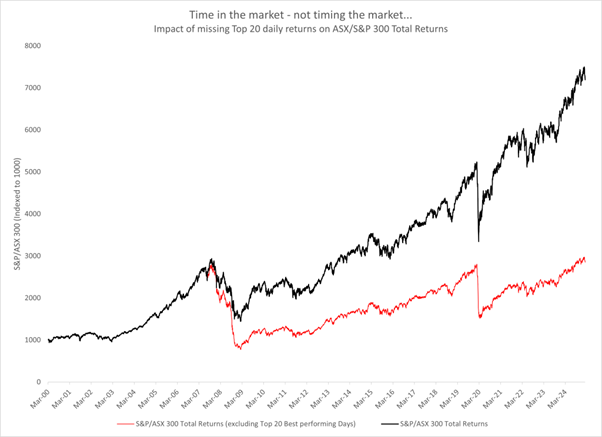
Analysis shows that many of the best performing days occur near the worst performing days, making active trading challenging. For example, at the height of the COVID downturn, the Australian S&P/ASX 200 fell -5.72% on 23 March 2020 as it hit its low, before bounding more than 10 per cent over the following three days.
Taking a longer term perspective, returns after significant market events such as the 1987 Crash, GFC and COVID-19 downturn recovered in subsequent periods. Currently, this market event does not compare in severity to these market-shaping downturns, but market behaviour often follows a similar path.
For investors that sell during a downturn, there is a secondary challenge – timing re-entry. This can be the hardest part, as often investors will sit in cash as they wait for any aftershocks from the correction event to subside. This is generally the period in which they miss the first significant gains after a market downturn.
Over the past thirty years, market rebounds have often coincided with intervention from either central banks, in the form of interest rate cuts or liquidity injections, or through fiscal support measures from governments. Market reactions to these measures have often resulted in sharp rebounds that would be missed by investors holding cash.
More generally, the market has repeatedly shown its ability to ‘price in’ economic and geopolitical risks, recover from an initial negative response to these risks, and resume an upward trajectory, even when the identified risks remain in play.
Another consideration when selling is capital gains tax (CGT), as any CGT payments required will effectively reduce the funds available for reinvestment. Transaction costs, whether they are explicit (such as brokerage) or implicit, (such as the capital cost of potential returns that could have been earned in an alternative asset) should also be considered when trying to time equity exposure.
It is a fundamental feature of the share market that stock prices reflect future expectations rather than current conditions, typically pricing in recovery scenarios months before economic data confirms improved conditions. Holding investments in defensive assets such as cash until conditions recover means that investors will not receive premiums for holding riskier assets.
The durability of equity markets can be observed by looking at long-term charts plotting the trajectory of equity returns. Historic events that felt seismic at the time are often but a small blip in the chart when viewed over the longer term. This highlights the financial benefits of compounding. It was none other than Albert Einstein that noted that compounding was the 8th wonder of the world. Unless market timing is impeccable, remaining invested through the cycle is the best way to benefit from the benefits of compounding.
Market downturns can be disconcerting for investors that are conditioned to markets going up. But, for most participants, the mathematical reality of missing rebounds may present a more significant risk than seeking to avoid temporary declines. This suggests that developing strategies to manage volatility within portfolios, rather than attempting to sidestep it entirely, aligns better with historical market behaviour and documented return patterns.
For investors that remain nervous about current investment conditions, NAB offers a range of investment strategies that can be utilised to manage their overall equity exposure.
To discover more call 1300 683 106, or email us on investordesk@nab.com.au
The information contained in this article is believed to be reliable as at April 2025 and is intended to be of a general nature only. It has been prepared without taking into account any person’s objectives, financial situation or needs. Before acting on this information, NAB recommends that you consider whether it is appropriate for your circumstances. NAB recommends that you seek independent legal, property, financial and taxation advice before acting on any information in this article.
©2025 NAB Private Wealth is a division of National Australia Bank Limited ABN 12 004 044 937 AFSL and Australian Credit Licence 230686.