We've captured the standout insights from the event series in an investor-ready eBook.


Report
Uncertainty on tariffs played a leading hand in substantial volatility over April as an initial rout was followed by a recovery
Executive Summary
Equity markets took investors on a rollercoaster ride in April, with the S&P/ASX 300 Index up +3.60% whilst the US S&P 500 returned -0.68%. Markets were down sharply at the start of the month before recovering most of the losses by month end. At its lowest, the US S&P 500 benchmark was down -11.19% with the S&P/ASX 300 down -6.07%.
The primary cause of the volatility appeared to be President Trump’s ‘Liberation Day’ statement on 2 April. The US President spooked global investors by announcing higher-than-expected trade tariffs against its trading partners. Investors reacted by selling equities on fears a tariff war could lead to higher inflation and lower global growth, and the potential erosion of the historic safe haven status enjoyed by the US dollar (USD).
In response to the imposition of US tariffs, reciprocal tariffs were announced by China that were subsequently matched and raised again by the US. By month-end, tariffs were at levels that effectively represent a trade embargo between the two economic powerhouses. Given the US dependence on China for its manufacturing capabilities, US consumers face the risk of empty shelves for impacted products if a negotiated outcome is not quickly secured.
A sharp rise in the US 10-year bond yield was the circuit-breaker, prompting the US President to declare a 90-day ‘cooling off’ period – creating a window for impacted countries to negotiate with the US for more favourable terms. Equity markets responded positively to the pause, with markets recording large gains on the day of the announcement. Volatility eased from extreme levels and markets gradually recovered their earlier losses over the subsequent weeks.
The tech-heavy NASDAQ benchmark was up +0.88% for the month. European markets ended slightly lower with the STOXX Europe 600 benchmark down -1.21%.
Like equities, bond yields were also volatile in April. The US 10-year bond yield initially fell sharply to under 4% in response to ‘Liberation Day’ tariffs before quickly spiking to nearly 4.50% due to concerns that the US safe-haven status was under threat with sustained capital outflows a risk. Higher yields and signs of market instability resulted in the 90-day ‘cooling off’ period to allow for trade negotiations.
Expectations for interest rate cuts increased, with current futures pricing anticipating the RBA to cut rates by 4-to-5 times by the end of the year to support growth.1 Expectations for rate cuts in the US were tempered by the risk of higher prices due to tariffs. The futures market currently expects 3-to-4 cuts in US official rates.1 By the end of April, the Australian 10-year bond yield was at 4.16%, down -0.22%. The US 10-year bond yield closed at 4.16%, down -0.04%.
Except for gold, commodity markets were generally lower in April reflecting demand concerns. Gold soared as investors sought out a safe haven to park their money. The yellow metal broke through the US$3,500 level, before easing as volatility unwound and the USD stabilised. Oil prices were down sharply given market fears of slowing global economic activity. Copper plunged at the start of the month, before reducing losses as the month progressed. Copper is also heavily influenced by global growth expectations. Iron ore was lower on concerns that tariffs imposed on China would hamper domestic demand as well as more general concerns for global steel demand. BHP ended the month broadly flat with Rio Tinto slightly higher.
The Australian market had a more muted response to the tariff saga, partly because we received the lowest level of imposed US tariffs, but also as Australia was seen as a safe haven relative to other equity markets. Sectors such as Consumer Staples (supermarkets) and Communication Services were among the better performing sectors in April, reflecting the defensive characteristics of these sectors under more volatile market conditions. Banks were strong performers, benefitting from inflows into the Australian market. Commonwealth Bank recovered losses incurred in March to again hit record highs. Information Technology stocks rebounded sharply as the month progressed.
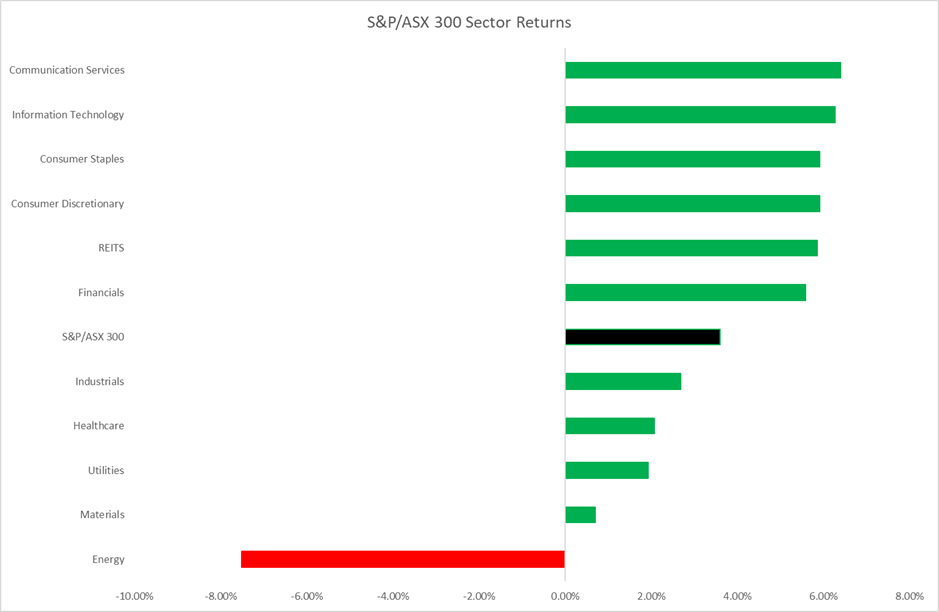
Energy seemed to be impacted by a falling oil price and fears of a slowing global economy. Lingering fears of yet-to-be announced pharmaceuticals tariffs seemed to weigh on healthcare stocks.
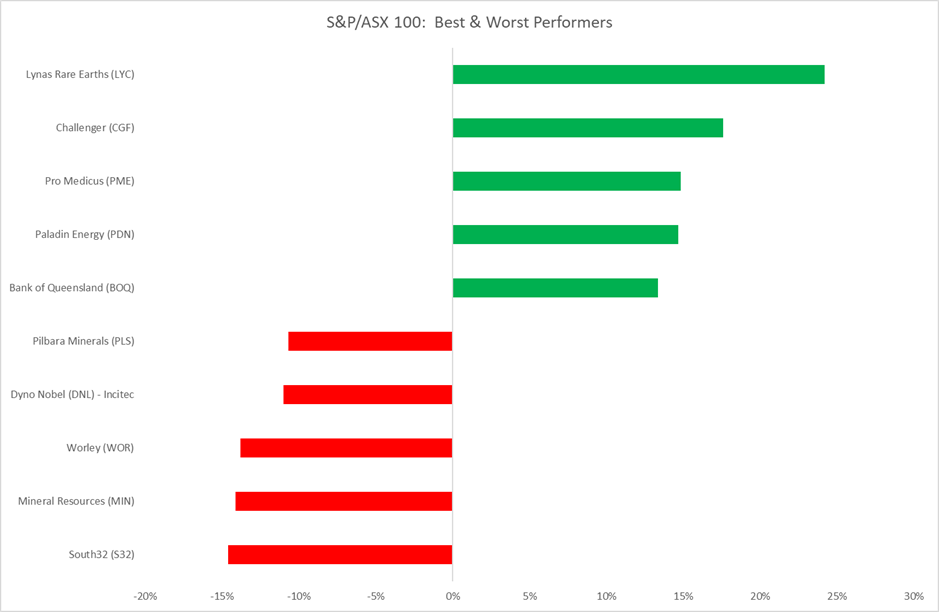
Large-caps slightly outperformed small-caps in April. Lynas Rare Earths benefitted from China’s decision to ban the export of key rare earths as a retaliatory action against US tariffs. Rare earths are used in advanced technologies including electric vehicles, fighter jets and robots. Challenger tightened profit guidance in an upbeat quarterly update. Pro Medicus rebounded after steep losses in February and March.
Pilbara Minerals reported lower quarter-on-quarter production and revenues at its quarterly update. As well as pressure on the lithium price, Mineral Resources was impacted by a lower iron ore price, but did recover some of its earlier losses by month end.
The performance of different investment styles can provide useful insights into market behaviour. From a US investment style perspective, momentum-based stocks rebounded strongly in April. Large-caps also tended to outperform small-caps, reflecting increased risk for smaller companies in a slowing economy. Quality-based factors also outperformed small-caps, reflecting investors’ preference for companies with a proven track record across the economic cycle. Value investing was a more difficult path, with relatively expensive, high growth names favoured over cheaper companies. This pattern of returns was also observed in Australia with momentum-based stocks outperforming small-caps at the expense of value.
Market volatility has spiked to levels seen only in extreme market events like the 2008-09 Global Financial Crisis and 2019 COVID epidemic. At its peak, the CBOE VIX metric (a popular measure of the stock market’s expectation of volatility based on S&P 500 index options) hit 52%, a level of volatility within the top 1% of observed values over the past 35 years.
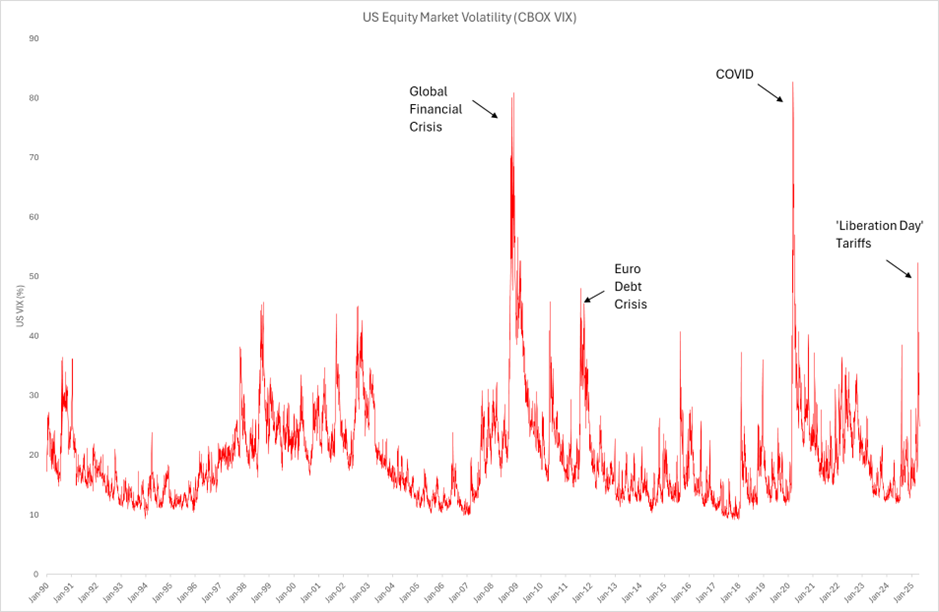
History indicates that investment returns 12 months after similar levels of volatility are generally positive.
The Australian market continues to be dominated by geopolitical themes and trade policy concerns. Although recent market weakness has seen valuations improve, the impact of tariffs on corporate earnings has not yet been captured in valuations. Compared to historic valuation levels (using forward consensus earnings estimates), the Australian market appears fully valued at current prices, particularly for large-cap stocks.
To discover more call 1300 683 106 or email us on investordesk@nab.com.au
Notes:
The information contained in this article is gathered from multiple sources believed to be reliable as at May 2025 and is intended to be of a general nature only. It has been prepared without taking into account any person’s objectives, financial situation or needs. Before acting on this information, NAB recommends that you consider whether it is appropriate for your circumstances. NAB recommends that you seek independent legal, property, financial and taxation advice before acting on any information in this article.
©2025 NAB Private Wealth is a division of National Australia Bank Limited ABN 12 004 044 937 AFSL and Australian Credit Licence 230686.
The information contained in this article is intended to be of a general nature only. It has been prepared without taking into account any person’s objectives, financial situation or needs. NAB does not guarantee the accuracy or reliability of any information in this article which is stated or provided by a third party. Before acting on this information, NAB recommends that you consider whether it is appropriate for your circumstances. NAB recommends that you seek independent legal, property, financial and taxation advice before acting on any information in this article. You may be exposed to investment risk, including loss of income and principal invested.
You should consider the relevant Product Disclosure Statement (PDS), Information Memorandum (IM) or other disclosure document and Financial Services Guide (available on request) before deciding whether to acquire, or to continue to hold, any of our products.
All information in this article is intended to be accessed by the following persons ‘Wholesale Clients’ as defined by the Corporations Act. This article should not be construed as a recommendation to acquire or dispose of any investments.

We've captured the standout insights from the event series in an investor-ready eBook.
Report


The level of bonds in an investment portfolio will be determined by your asset allocation strategy combined with risk preferences and income needs

Article
© National Australia Bank Limited. ABN 12 004 044 937 AFSL and Australian Credit Licence 230686.