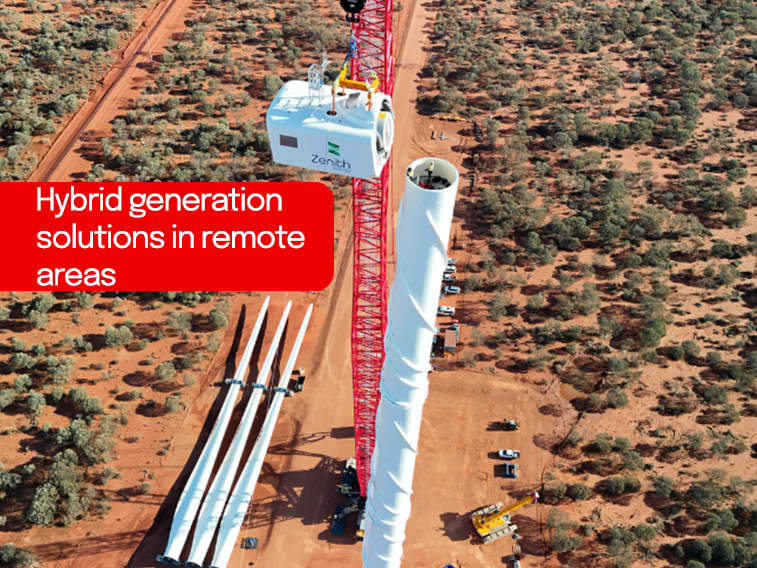
May 6, 2019

NAB Online Retail Sales Index, Monthly Update – March 2019

The NAB Online Retail Sales Index rebounded strongly in March with sales growth of 1.7% month-on-month, after one of its worst growth rates in the series history in February.

  • The NAB Online Retail Sales Index expanded 1.7% in March on a month-on-month, seasonally adjusted basis. The January result has been revised to slight growth (was -0.1% mom, s.a.), and revisions see the February result less contractionary (-1.0%) than our previous estimate (-3.7%).
  • In year-on-year terms the NAB Online Retail Sales Index was positive, up 5.0% (y/y, s.a.) in March. However, this result is compared to March 2018, which was one of the strongest months recorded for online retail sales.
  • Six of the eight categories recorded a month-on-month sales growth, with growth in the largest sales category, Homewares and appliances (2.0% mom, s.a.), slightly faster than the overall. Year-on-year growth is positive for seven of the eight NAB Online Retail Sales Index industry groupings. Department and variety stores remains the fastest growing category in both year-on-year (22.7% y/y) and month-on-month terms (+8.0% mom, s.a.). For more detail, see Charts 3, 5, 7 & 8 below.
  • In month-on-month terms, all states and territories recorded growth, with Tasmania (+10.4%) rebounding strongly after last months considerable contraction. Growth in the month was slowest in Queensland.
  • At 1.6%, Domestic online retailers performed better in month-on-month terms relative to International competitors (0.6% mom, s.a.). In year-on-year terms, from our series, there seems to be considerable weakness in international online sales. See charts 13 and 14, and table 3 for category growth and share.
  • As part of the continual improvement of the series, this month we have revised our total market estimates. We have identified and removed potential wholesale trade transactions made on personal accounts. We have also identified more transactions that are made using a ‘stored credentials’ technique of online purchases. This technique is increasing in popularity as consumers opt for convenience especially with purchases made using mobile apps. Finally, in March 2018 the RBA made changes to its Payments System Data which we use as an input into our estimate of online total market size. These revisions are retrofitted to the series history.
  • From this, we estimate that in the 12 months to March, Australians spent $28.76 billion on online retail, a level that is close to around 9% of the traditional bricks and mortar retail sector (February 2019, Australian Bureau of Statistics), and about 18% percent higher than the 12 months to March 2018.

For further details, please see the NAB Online Retail Sales Index – March 2019