Firmer consumer and steady outlook


Insight
A rapid escalation in volumes and additional liquidity in the A$ financial institution (FI) bond market for 2023 have come at just the right time, creating opportunities for the funding task in 2024.
Looking back at 2023 with all that’s unfolded, it’s tempting to say: “Really, is that all you’ve got?”
It was a frenetic and historic year of issuance for the A$ FI bond market when you consider we have seen A$119 billion of issuance which is 20% up on 2022 and 190% on 2021.
Not only was the total volume impressive, but the way deals have been executed is perhaps something the more seasoned of us in market could not have anticipated.
The market today has A$5 billion deals as a regular occurrence for the major banks, whereas in 2022 an average benchmark-sized transaction (three and five-years) was circa A$4 billion. Going back to 2019 and this was probably closer to A$3 billion.
The change in volumes and the additional liquidity have come at just the right time as banks grapple with the term funding facility (TFF) refinancing task, with many of us hoping the current dynamic stays with us for at least a couple more years!
Supply side: The issuance trends from the major banks played out largely as we predicted this time last year. We saw significant funding volumes as the banks approached the first tranche of the TFF in Q2 of 2023 and attempted to get ahead of their 2024 towers.
The major banks completed about A$122 billion1 of senior funding (across A$, US$ and €) for their financial years ending September 30 (with June 30 for CBA). This figure excludes Additional Tier 1 (AT1) and securitisation funding.
Looking ahead and taking upcoming maturities as a proxy for funding needs, there is potentially a chunky A$1532 billion of supply to come in 2024.
Of this, A$70 billion comes from TFF maturities, most of which fall in June 2024. Interestingly, CBA accounts for about half of this amount at A$32 billion. Now the argument most banks run with is that not all TFF gets refinanced in the term markets and the funding needs to reflect broader balance sheet composition – including deposits, negotiable certificates of deposit (NCD), residential mortgage-backed securities (RMBS), covered bonds and more.
RBA term funding facility maturities – 2024
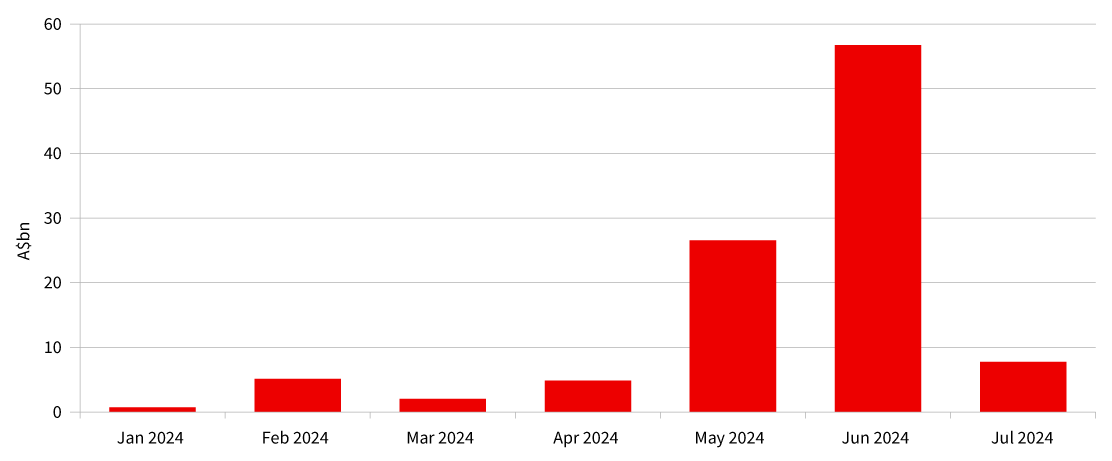
Source: NAB internal data; RBA.
Given the above, it’s not surprising that the banks have looked to maximise volume in each of their public benchmark transactions. Couple this with the fact that the A$ market has been somewhere between 20 to 30 basis points cheaper than the offshore market over the course of this year, the need to maximise the volume from the A$ market becomes even more clear. On average this year the major banks have taken close to 40% of their term funding from the domestic market, where a longer-term average would be closer to 25-30% depending on the bank.
Demand side: There were clearly some tailwinds supporting the record issuance this year.
For APRA-regulated super funds and the volumes from September 2022 to September 2023, balances grew from A$3.2 trillion to A$3.5 trillion3. Within this, there was a 1% rotation into fixed income. This increase in super balances combined with the incremental allocation to fixed income represents a A$64 billion increase in fixed income assets.
The shifting interest rate environment has further encouraged assets outside of the superannuation sector into the fixed income market. The returns available on the five-year major bank bond at 5.4% compare favorably with dividend yield on the S&P ASX200 High Dividend Index which has a dividend yield of 6.04% (gross)
Maturities for 2023 were A$78 billion, with the largest quarters being Q2 and Q3, corresponding to particularly busy issuance windows. Even with this amount of FI maturities, YTD is still tracking at A$49 billion of net issuance. At certain points in the year, it has been clear the larger deals have been timed to correspond with upcoming liquidity events.
A$ financial redemptions vs. new issuance – 2023 YTD
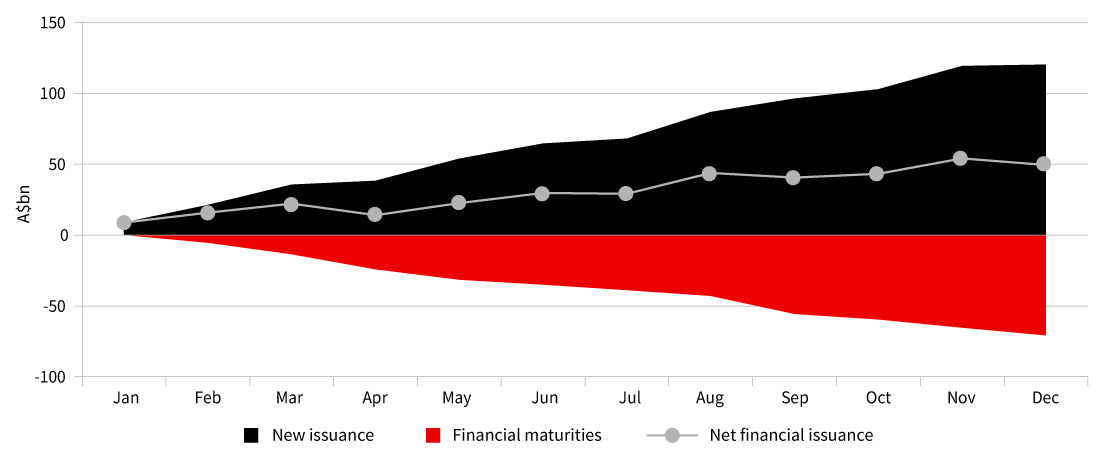
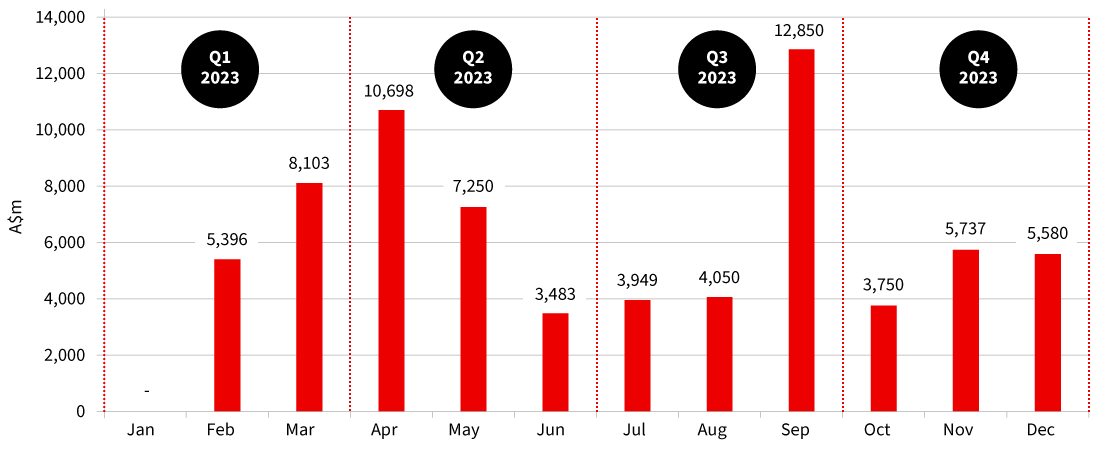
Source: NAB internal data, Bloomberg.
Credit spreads have also traded in a somewhat narrow range for the major banks this year. The tightest levels have been 75 basis points and 93 basis points for three-years and five-years respectively and the widest levels have 90 and 118 basis points for the same tenors. This is much to do with the volume that has been digested and a degree of anticipation from investors as to when supply may be imminent (associated selling to free up lines).
A$ major credit spreads
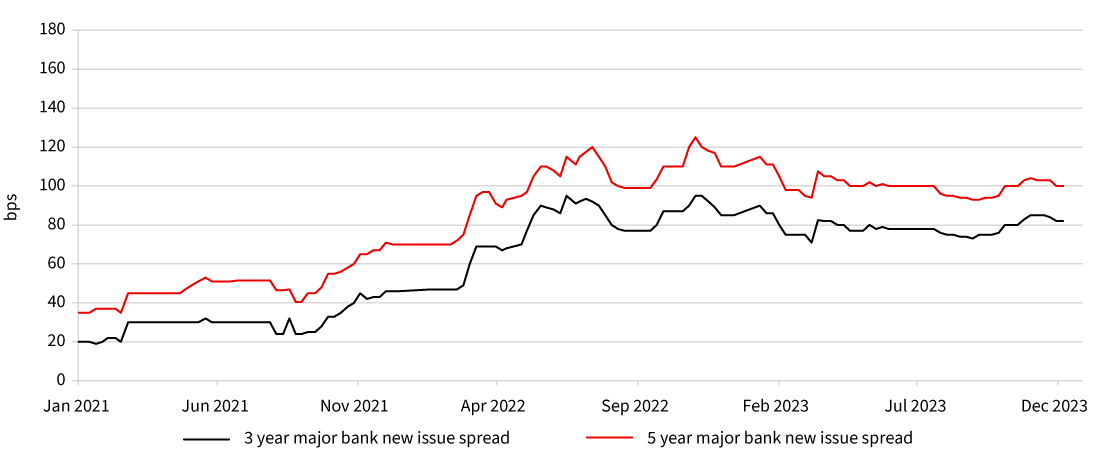
Source: NAB internal data, Bloomberg.
Regulation: The ramifications of APRA’s November 2022 letter on the callability of Tier 2 instruments played out well into 2023, with investors and bankers focused on the upcoming calls of low coupon bonds. In offshore markets there was a degree of reluctance from some investors to participate in callable structures. Ultimately this concern dissipated, with issuers increasing the data in their submissions, but it did see a push wider in spreads (albeit temporarily) in the market. It also led to the inclusion of some investor-friendly language in certain instruments (primarily in the insurance space).
APRA refined its messaging to the market in Q3 of 2023, with the release of a discussion paper on the effectiveness of AT1 and a paper on the APS 210 standard for liquidity. Both are set to play out through 2024. The APS 210 paper has the potential to significantly impact the mutual sector as some of the more significant changes will impact banks regulated under the Minimum Liquidity Holdings (MLH) classification and bring them more in line with the banks covered under the Liquidity Cover Ratio definition.
Spread divergence: We have seen an ongoing diversion in spread performance for the non-AA-rated banks over the course of the year. A clear example of this can be seen with the mutual sector which has traded out to about 70 basis points wide of a three-year major bank, from an historical average of closer to 35 to 40 basis points. There is a similar, but less dramatic shift for the BBB+ sector. While there is no obvious reason for this, we can attribute some of it to investor preference for larger, more liquid lines and the fact that with the removal of the committed liquidity facility (CLF) there is less capacity from the larger bank balance sheets to support these names.
This time last year we advocated to “go hard and go early” and we think this strategy paid dividends for those who moved first. Bank of Queensland and Bendigo and Adelaide Bank both hit the market in January 2023 managing to access competitive four-year funding at benchmark size.
This was in conjunction with CBA and Rabobank accessing the market in those first few weeks as well.
Again, we recommend for issuers to go hard and go early in 2024. The maturity volumes peak in the first half of the year and it will be potentially beneficial to access this liquidity as soon as possible. Investors will be on the desks from the second week of January and if banks have funding to do, we recommend being a fast follower behind the first major bank to open the market, which we expect to be CBA again for 2024.
Tier 2 issuance will continue, but it won’t be the wave the market had perhaps anticipated when the additional loss-absorbing capacity (ALAC) requirements were first communicated. Looking at the full year debt investor presentation from the four majors and Suncorp, it is clear the T2 requirement is very manageable at about A$3 to A$4 billion per major (less for Suncorp), and subject to market we see a real opportunity for this product to rally through 2024.
Asia and particularly China will continue to weigh on regional credit, noting however the A$ market was an actual beneficiary of this in 2023. Starved of US$ product, combined with a weak A$ currency, meant Asian accounts turned their attention to A$ fixed income product. It seems hard to see that trend reversing as it will take a number of years for China to rectify their internal challenges of deflation and an ageing population.
Equities rally: This may see a revision of the allocation to fixed income. If we assume the A$ credit market was a beneficiary of that in 2023, any reduction could lead to pressure on spreads and a reduction in transaction volumes.
Rate cuts: If we see aggressive rate cuts throughout 2024, which leads to rotation out of fixed income, clearly this could adversely impact demand for A$ credit.
I don’t see these events as the base case right now, however, so I am going into 2024 with a glass half full – although full of what is yet to be decided.
1. Annual investor report from Australian and New Zealand Banking Group, Commonwealth Bank of Australia, National Australia Bank and Westpac Banking Corporation.
2. Bloomberg and Annual investor report from Australian and New Zealand Banking Group, Commonwealth Bank of Australia, National Australia Bank and Westpac Banking Corporation.
3. APRA quarterly superannuation statistics.

Firmer consumer and steady outlook
Insight


Global growth headed for a H2 trough as tariffs start to bite

Insight
© National Australia Bank Limited. ABN 12 004 044 937 AFSL and Australian Credit Licence 230686.