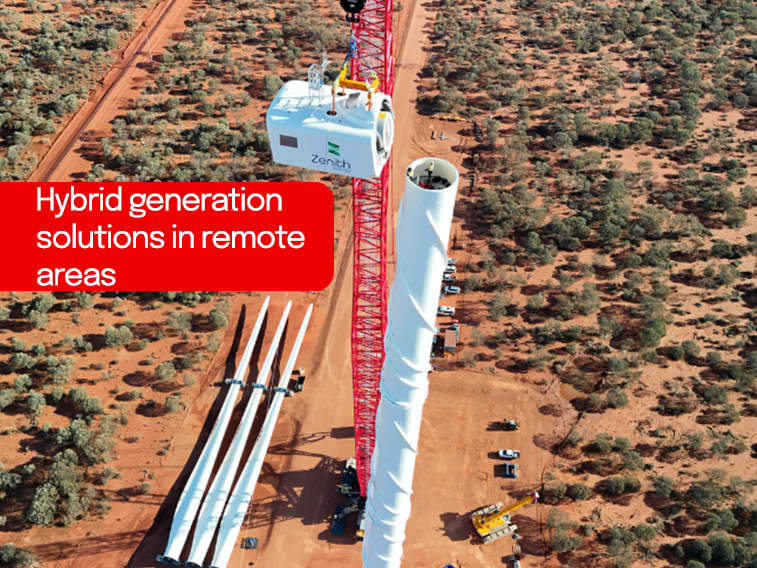
NAB client Zenith Energy’s innovation is helping decarbonise the mining sector through providing efficient hybrid generation solutions in remote areas.

The AUD/USD traded in a range of just over 2 cents in April, with (very) brief and small-scale forays above and below the 0.70 to 0.72 range that had confined it since early February.
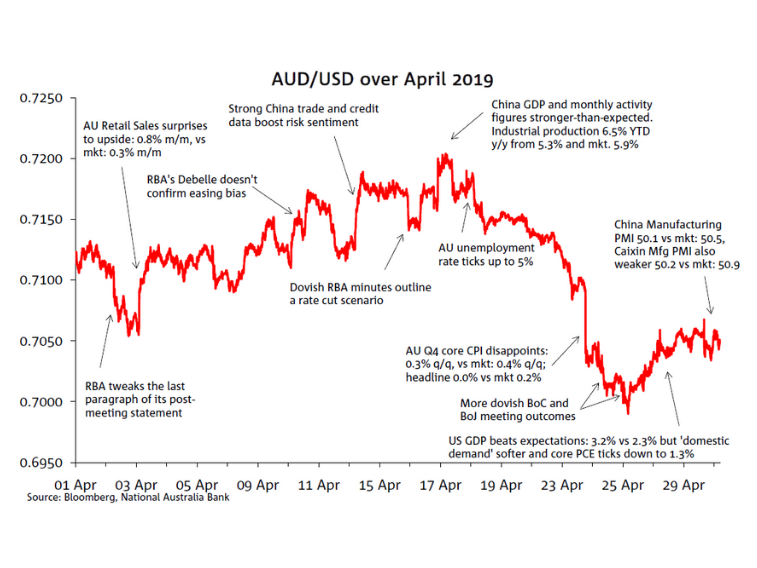
Higher oil prices and strong China data mid-month supported the currency and saw the AUD/USD reach a high of 0.7206 on 17 April. In contrast, a more accommodative outlook for RBA monetary policy, in combination with a weak AU CPI print on 24 April, saw the currency fall to a monthly low of 0.6988 on 25 April. Net-net, the AUD/USD ended the month at 0.7048, around ¾ cent below its 0.7123 start point.
Near-term RBA cash rate expectations shifted considerably during April and was one key to volatility in AUD/USD. Early in the month (2 April) the currency dipped to 0.7086 after the RBA post-meeting statement revealed a dovish tweak to the final paragraph on monetary policy, putting the market on alert for a possible May cut to the cash rate.
Over the next couple of weeks, stronger-than-expected AU retail sales, strong China data and higher oil prices supported a modest uptrend in the currency, despite mixed messages from the RBA (no signs of dovishness from Deputy Governor Debelle, but a rate cut scenario outlined in the Minutes). The AUD/USD reached its monthly high of 0.7206 on 17 April, following solid China Q1 GDP figures and March monthly activity indicators (industrial production in particular).
Weak AU inflation on 24 April soon saw the AUD/USD quickly fall to 0.7036, as market expectations for a May cash rate cut rose sharply. Dovish tones from the BoC and BoJ the day after further weighed on the currency and the AUD/USD touched its monthly low of 0.6988 on 25 April. Towards the end of the month, weak US inflation data and month-end hedging generated USD selling, helping AUD/USD lift a little, such that the currency ended the month at 0.7048.
AUD/USD traded slightly below NAB’s daily STFV model estimates for almost the entire month; it began April trading almost a cent below STFV and ended the month ‘undervalued’ by about half a cent (chart 2).
At its extreme, the gap between AUD/USD and STFV opened up to almost two cents, in the context of the AUD drop below 0.70 in the wake of the weak Q1 GDP figures but which was not mirrored in STFV, the latter closer to 0.72 during this time with the (AUD-negative) widening in the negative AU-US 1-year rate spread offset by a positive influence from commodity prices and risk sentiment.
Risk sentiment was an overall positive on the month (VIX slightly lower on the month) while interest rate differentials moved slightly against the AUD. Commodities were an overall net negative, with support from oil, coal and to a much lesser extent iron ore (iron ore has a very small weight in the model) more than offset by slippage in gold and base metal prices, specifically aluminium (Chart 3).

NAB client Zenith Energy’s innovation is helping decarbonise the mining sector through providing efficient hybrid generation solutions in remote areas.


Confidence and Conditions Lift

Insight
© National Australia Bank Limited. ABN 12 004 044 937 AFSL and Australian Credit Licence 230686.