Firmer consumer and steady outlook


Insight
The AUD have an ‘average’ August in terms of its monthly hi-lo range, albeit it fell to a near 10-month beneath 64 cents

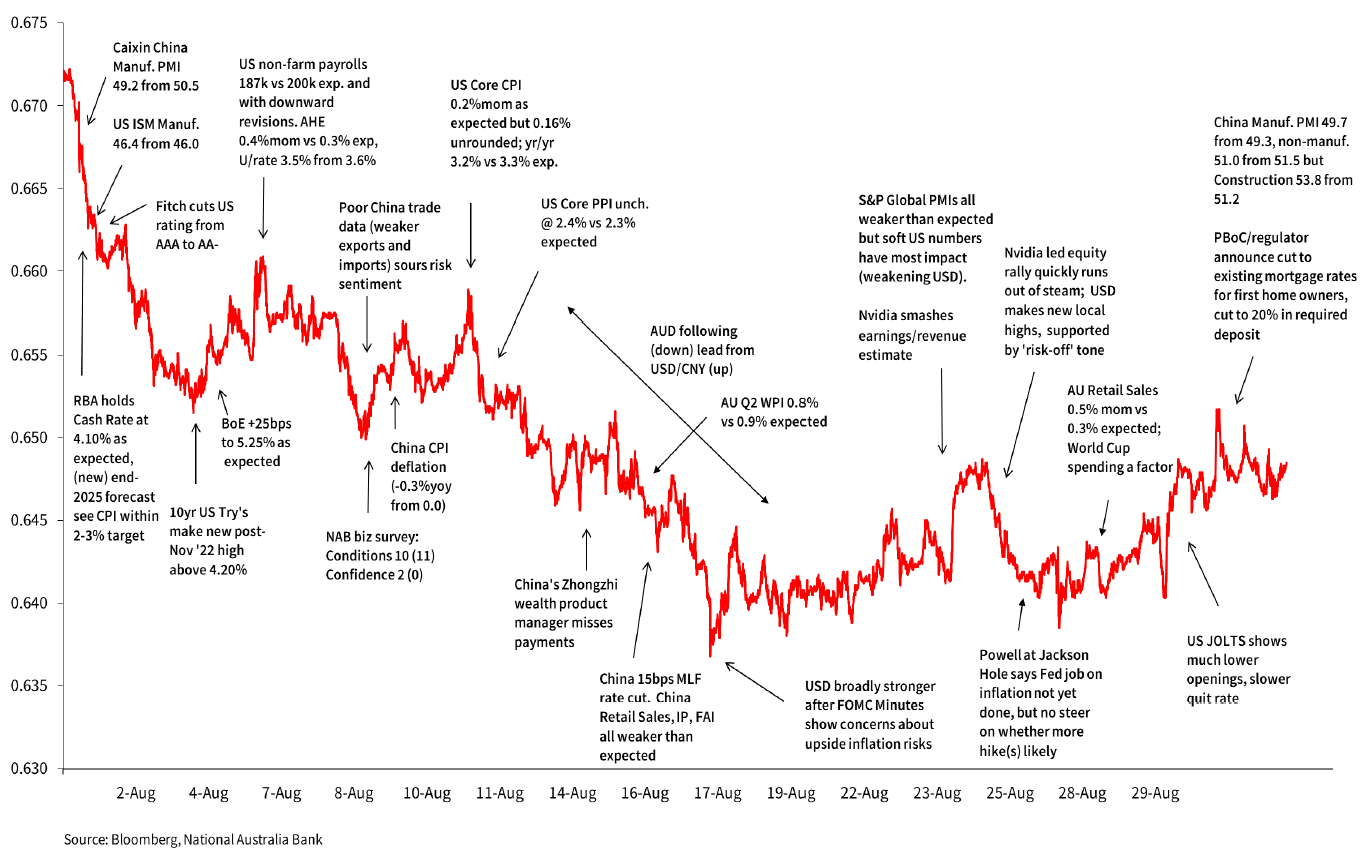
Following a below-average monthly high-low range in July, AUD/USD had an ‘average’ August, encompassing a 3.6 cents range in line with the long-term average (see Chart 1). AUD/USD made its high of 0.6723 on the first day of the month and a low of 0.6363 on Sep 17.
From its opening highs above 0.67, AUD/USD trended lower from the get-go, hurt both by weaker than expected China manufacturing PMIs then the RBA no-change, the latter as expected but where new SoMP forecasts showed inflation within target in late 2025. Indeed, subsequent RBA Minutes noted the Board foresaw a ‘credible path to the inflation target with the cash rate staying at the present level’).
As August wore on, increased pessimism about China growth prospects, amid only minor piecemeal announcements of policy support and mostly monetary not fiscal policy related, weighed on AUD in conjunction with progressive strengthening of the USD/CNY rate, which PBoC ‘protests’ via setting the daily USD/CNY fix well below market implied rate did little to arrest.
Contributing to AUD weakness alongside CNY weakness, culminating in the fall to below 0.64 at mid-month, was USD strength in conjunction with rising Treasury yields (10s going on to make a new post-November ’22 high above 4.30%). The recovery from sub-0.64 to around 0.65 in the latter part of the month was associated with a softening USD (e.g. after a weaker JOLTS report) and some slightly better news of out of China, including Manufacturing and Construction PMIs, mortgage rate cuts for existing borrowers and lower required deposits.
For further FX, Interest rate and Commodities information visit nab.com.au/nabfinancialmarkets. Read our NAB Markets Research disclaimer.
© National Australia Bank Limited. ABN 12 004 044 937 AFSL and Australian Credit Licence 230686.