Robust growth for online retail sales observed in June


Insight
In June, the AUD/USD saw a new year-to-date low – a level last seen in May 2017 | Over the fiscal year the AUD/US traded between a high of 0.8136 and a low of 0.7311.
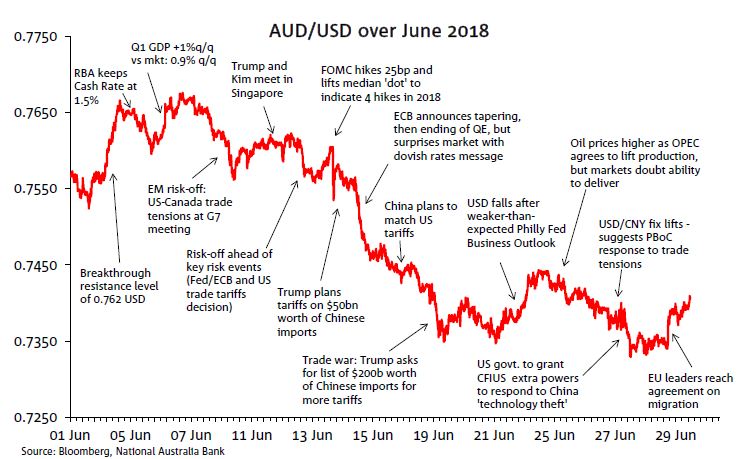
The AUD/USD came under pressure in June amidst US-led trade tensions and ongoing Emerging Market (EM) concerns. Over the month, the AUD/USD fell from 0.7567 to 0.7406, and saw a new year-to-date low of 0.7323 (June 28th) a level last seen in May 2017.
Stronger-than-expected Australian GDP partials early in the month supported the AUD/USD, culminating in a solid print for Q1 GDP growth of +1% q/q (June 6th). The AUD/USD saw its monthly high later that day, of 0.7677.
However, as trade tensions built up, the AUD/USD quickly came under pressure with the currency affirming its status as the market’s preferred China/Asia EM risk proxy. The USD was briefly supported on June 14th by the FOMC decision to lift the Funds rate by 25bps and the revelation of an expected additional hike for 2018 (higher dot). Shortly after, Trump’s plan to impose tariffs on $50bn worth of Chinese imports was an additional weight on the AUD/USD. Later that day the ECB announced its plans to end its QE programme, but its commitment to keep the deposit rate unchanged “at least through the summer of 2019” rattle markets and further compounded the AUD/USD decline.
Later in the month the AUD/USD remained under pressure following China’s announcement that it would match US tariffs and Trump’s response to seek a list of an additional $200b worth of Chinese imports for more tariffs (June 19th). While higher oil prices provided some support for the AUD/USD, further US-China trade tensions brought the AUD/USD to its year-to-date low of 0.7323, before the June 29th announcement of an EU migration agreement helped the currency pair recover to 0.7406 into month/EOFY end.
The gap between our Short Term Fair Value (STFV) model estimate and spot marginally widened in the month of June as the AUD/USD declined 1.7 cents to 0.7406 while our STFV declined 1.4c to 0.7630. This means the AUD/USD ended the month of June 2.2 cents cheap, but not quite at an extreme level to suggest a correction looks imminent (i.e. outside +/- 1.5 standard deviation range, see Chart 1).
The decline in our STFV during June was largely driven by a negative contribution from commodities despite decent gains for thermal coal (5.6%) and Brent oil (2.4%). These gains were more than offset by declines in aluminium (-6.9%), gold (3.5%), coking coal (2.6%) and wheat (5.4%).
Further compression in the AU-US rates differential (1y OIS), following the Fed Decision to lift the Funds rate by 25bps in June, and a small uptick in the VIX index were additional negative contributions to the changed in the STFV during the month (Chart 3). The VIX index is our proxy for risk sentiment and given the recent US led trade tensions, we are wary of the VIX underestimating the current level of global risk aversion, suggesting our AUD STFV estimate may also currently be somewhat overstated.
Below chart shows the AUD/USD performance over the course of the last financial year.


Robust growth for online retail sales observed in June
Insight


Coming in for landing in a heavy cross wind

Insight
© National Australia Bank Limited. ABN 12 004 044 937 AFSL and Australian Credit Licence 230686.