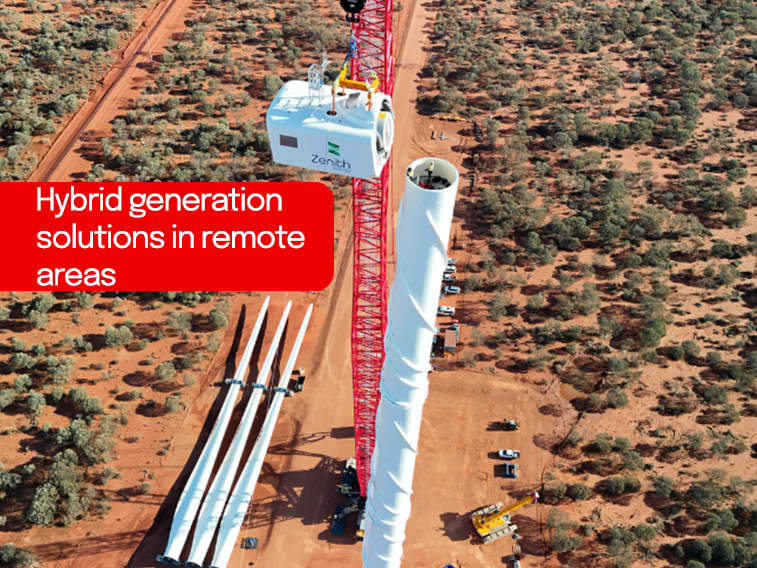
NAB client Zenith Energy’s innovation is helping decarbonise the mining sector through providing efficient hybrid generation solutions in remote areas.

The Manufacturing Activity Index was unchanged in Q3 – despite diverging trends in the index components – remaining at negative levels. The index indicates further falls in Manufacturing growth in the quarter, which remains burdened by global economic trends and the strength of the dollar

The Manufacturing Activity Index* was unchanged in Q3 – despite diverging trends in the index components – remaining at negative levels. The index indicates further falls in Manufacturing growth in the quarter, which remains burdened by global economic trends and the strength of the dollar.
*NAB’s Manufacturing Activity Index (MAI) has been constructed to replicate quarterly movements in activity in the manufacturing sector. It comprises weighted components of business confidence and profits (in turn based on weighted movements in output and input prices, which are lagged by two quarters). The MAI signals further decline in quarterly manufacturing activity in Q3 2012 – with the index equivalent to a decline of around -0.9%.
For further analysis download the full report.

NAB client Zenith Energy’s innovation is helping decarbonise the mining sector through providing efficient hybrid generation solutions in remote areas.

RBA surprises with a hold, NAB still sees cuts in August, November and now February

Insight
© National Australia Bank Limited. ABN 12 004 044 937 AFSL and Australian Credit Licence 230686.