Total spending grew 0.9% in June.

Our NAB Online retail sales index data indicates a return to sales growth in May 2019, after considerable weakness in April.
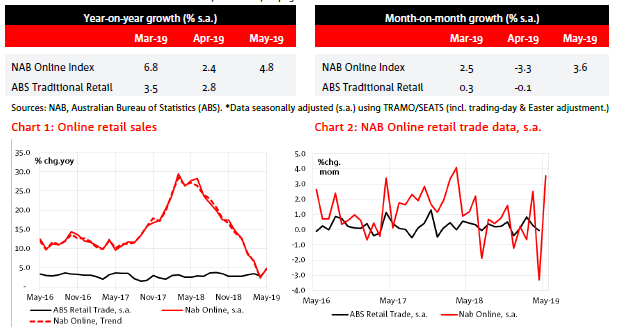
For further details, please see the NAB Online Retail Sales Index – May 19

Total spending grew 0.9% in June.

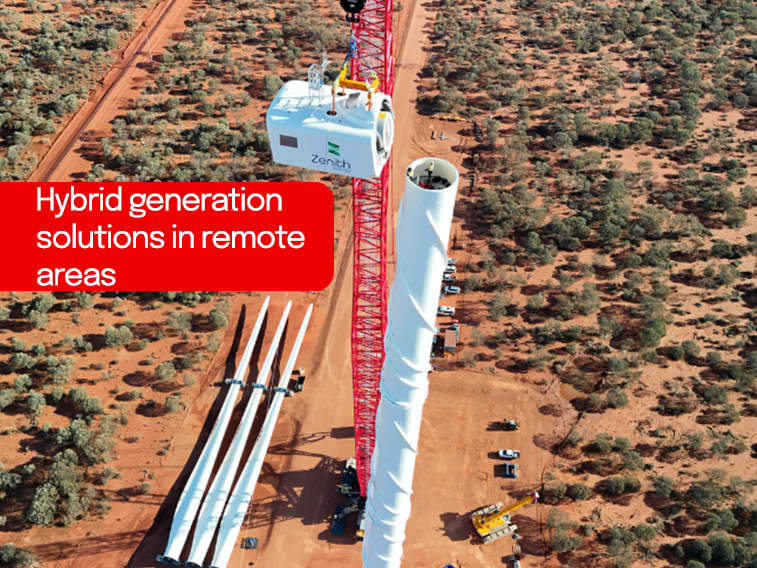
NAB client Zenith Energy’s innovation is helping decarbonise the mining sector through providing efficient hybrid generation solutions in remote areas.

© National Australia Bank Limited. ABN 12 004 044 937 AFSL and Australian Credit Licence 230686.