On a seasonally adjusted basis, the NAB Online Retail Sales Index recorded a drop in growth in July


Insight
NAB and ASFA examine superannuation portfolio holdings disclosure data released this year as part of regulatory changes aimed at enhancing industry transparency.
With the nation’s superannuation pool forecast to almost double to $A6 trillion by 2030, there is an important and timely opportunity to assess investment behaviours amid today’s environment of heightened uncertainty.
NAB researchers have recently undertaken a detailed review of a large sample of the portfolio holdings disclosure (PHD) data made available this year under regulatory changes for the industry.
The study aims to give superannuation fund investment teams, trustees and ultimately members greater insights into the breadth of investment strategies, country exposures and derivatives hedging being used to protect returns in volatile markets.
“From our analysis of the data released to June 30, we’ve found large superannuation funds are well prepared for further market volatility, with high levels of liquidity in the investment options we’ve examined over the period,” NAB Head of FX Investor Sales, Global Markets, Jamie Bonic says.
“Given the conditions since March, as central banks seek to curb inflation, the data shows funds have moved pre-emptively to increase liquidity while not deviating materially from their strategic asset allocation [SAA].
“The research indicates funds remain well-diversified across a range of investment strategies which should help reduce investment risk and produce more stable returns in the longer term for members.”
Under the regulatory changes, super funds are now required to disclose their individual holdings across all asset classes in some detail and make the information publicly available on their websites within 90 days of the reporting periods to June 30 and December 31.
For the analysis, NAB has examined data taken from 14 of Australia’s largest super funds, with a focus on their MySuper or similar investment products. Taken together, the study covers more than a million individual holdings and represents about 80% of the assets under management for these type of investment options.
The review found the average actual asset allocation between growth (68%) and defensive assets (32%) was closely aligned to SAA for the funds of 67% and 33% respectively.
“This likely reflects the awareness of an increasingly uncertain macroeconomic backdrop,” Bonic says. “Interestingly, the range for growth assets was as high as 81% and for defensive as low as 19%.”
Looking at holdings by asset class for the period, the data shows funds were on average overweight cash (7%) and equities (57%) and underweight fixed income (13%) and alternative strategies (2%).
Actual asset allocation – MySuper-like investment options
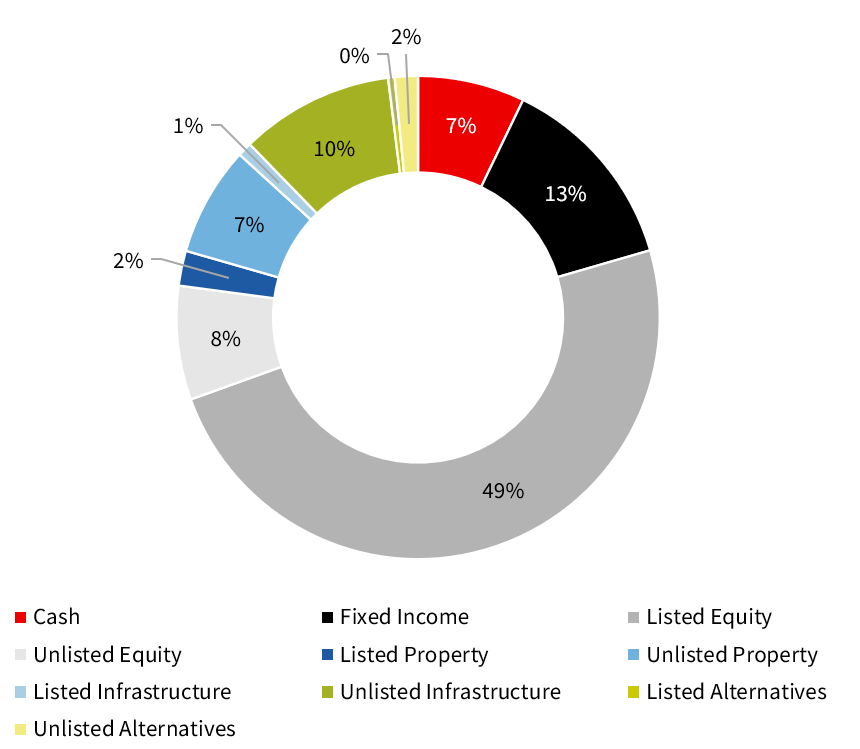
It seems many super funds have also pursued the illiquidity risk premium associated with unlisted assets, says Bonic. The cohort of funds examined had exposures of more than 27% to unlisted markets across equity, infrastructure, property, and alternatives compared with the APRA SAA of 22%.
“What we are seeing is a barbell strategy in play between overweight cash to counterbalance the holdings in unlisted assets,” says Bonic. “In managing risk, members can also note that approximately 95% of listed assets are currently invested in developed markets, with only 5% in emerging markets.”
A closer look at the Global Industry Classification Standard (GICS) sectors demonstrates some significant deviations from the widely-used MSCI ACWI benchmark, which reflects the ongoing home country allocation bias.
The analysis confirms funds still retain a large exposure to Australian listed assets (46%), with the US the next largest allocation (32%) followed by Europe (5%).
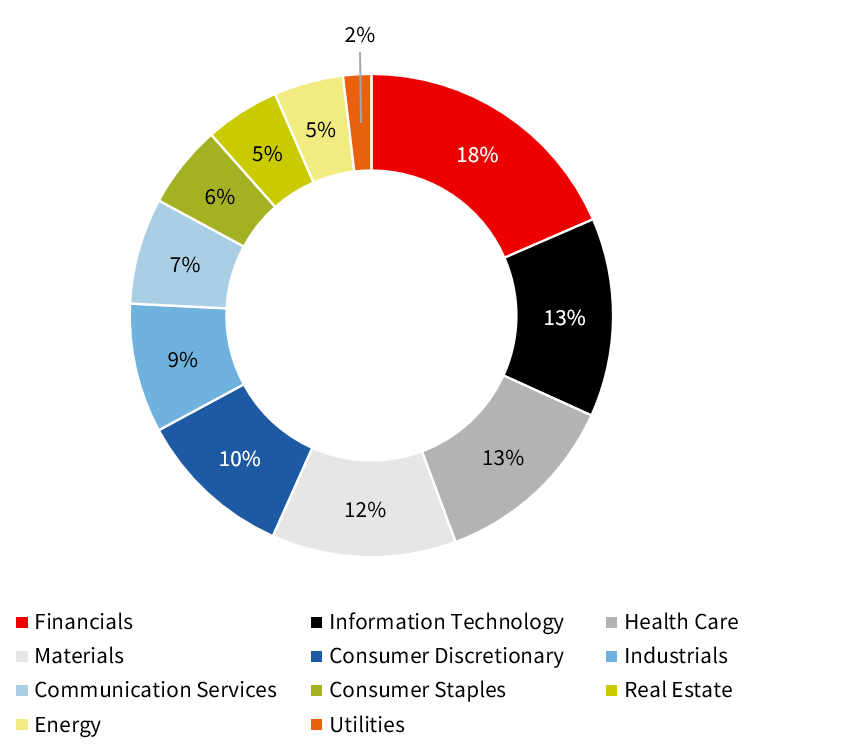
Australian super funds were heavily overweight in financials (18% v the MSCI ACWI benchmark allocation at 14%) as well as being underweight in energy. The cohort was also underweight in the highly volatile tech sector (13% v MSCI ACWI benchmark allocation at 21%).
GICS sector: MySuper-like investment options (listed assets)
While funds have a significant stake in the local economy, the ongoing growth of the superannuation pool suggests the total allocation to offshore assets is set to rise as these six-monthly “snapshots” continue.
“The size of the super system has increased at a faster pace on average than the size of the Australian economy,” Bonic says. “Compared with large pension funds in other advanced economies, large Australian super funds in fact tend to have a relatively lower allocation to offshore assets.
“Our experience with pension or superannuation markets such as Canada, the UK and the Netherlands highlights that domestic markets reach a saturation point for local equities. Investors look offshore both for diversification and attractive returns for their members.”
The NAB research covered a significant sample across more than 400 investment options, about 500 external investment managers (or directly owned assets) and over 21,000 unique security identifiers.
A take-out from the analysis is the breadth and range of these external managers being used, despite the more recent trend to internalise many investment strategies. Of note, however, is nearly half of all unlisted assets were managed by a group of 20 investment managers across different asset classes in the cohort’s disclosure data.
The data also show mark to market derivatives exposures were relatively modest at 1.1% of total assets.
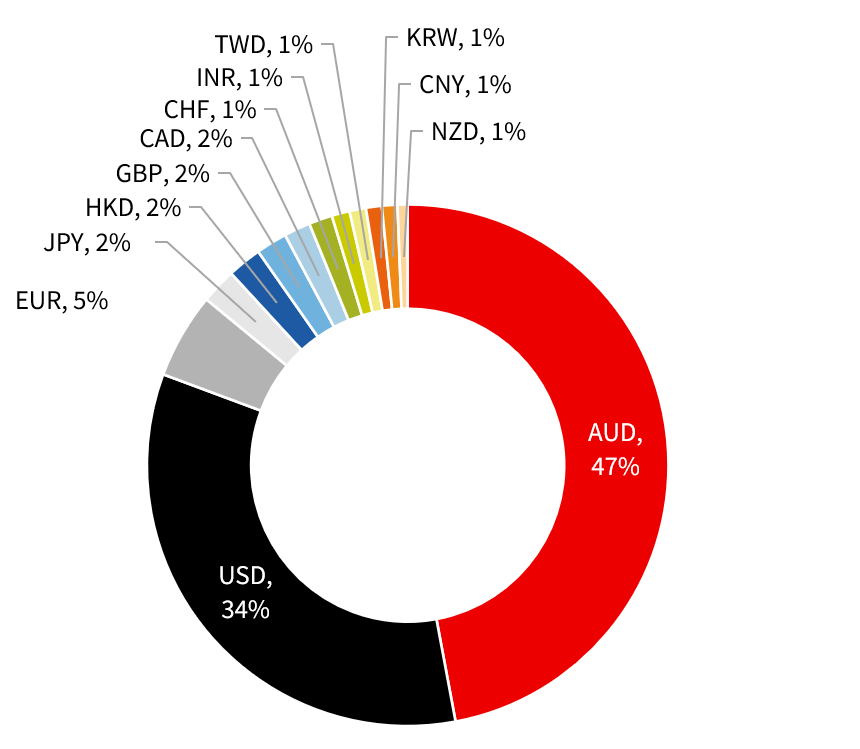
While derivatives across asset classes can be used both to mitigate risk and enhance returns, the analysis identified FX forwards for hedging currency exposure as the most significant derivative usage by super funds. In aggregate, the use of currency derivatives by this cohort of funds implies, on average, a 25% purchase of AUD and sale of foreign currencies in their hedge programs.
Currency exposures: MySuper-like investment options (listed assets)
ASFA Chief Executive Officer Martin Fahy says the data review highlights the resilience in the investment strategies and diversification of risk within Australian superannuation.
“We can see here the system is highly diversified across asset classes and geographies,” Dr Fahy says. “It’s highly liquid through cash and listed equities and is benefitting from international opportunities in developed and emerging markets.
“Funds have obviously made extensive use of risk protection mechanisms through the use of derivatives and downside protection and make use of world class managers with deep subject matter expertise across specific asset classes.
“Given the global challenges today, this is a timely snapshot providing transparency for the industry which shows the system is in great shape for members.”
Request a copy of the full survey findingsThere are further updates and insights planned as future data releases become available.

On a seasonally adjusted basis, the NAB Online Retail Sales Index recorded a drop in growth in July
Insight


Firmer consumer and steady outlook

Insight
© National Australia Bank Limited. ABN 12 004 044 937 AFSL and Australian Credit Licence 230686.