Long-term signal vs. Short-term noise


Insight
In February the AUD/USD gave back all of its January gains and some more. February was a month characterised by an increase in market volatility, particularly in equities amid US inflationary concerns alongside a rise in US bond yields and their implicit valuation concerns for physical and risk assets.
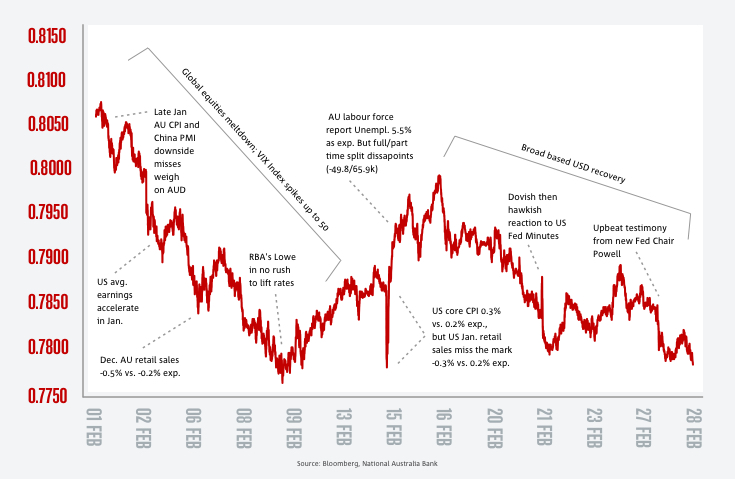
The AUD/USD declined 2.5 cents in February with the monthly highs of 0.8067 recorded on the 1st of the month and the low of 0.776 on the 9th of the month.
The currency began the month under pressure following a series of soft local data releases late in January/early February. Then the jump in US average hourly earnings triggered a selloff in US bonds and stocks amid concerns over a potential pick up in US inflation. The higher yields/risk negative tone propelled an across-the board extension of a nascent USD recovery, led by more AUD weakness. AUD/USD ended the first week of February 2.2% lower at 0.7931, half a percent more than any other G10 currency. That week the RBA left the cash rate unchanged and in a speech Governor Lowe reiterated the message that the Bank is in no rush to lift rates.
On the 9th of the month, President Trump signed a bill to end the government shutdown clearing the way for a massive boost to military and domestic spending. This also triggered a period of USD weakness as the market began to fret over the impact a growing twin deficits could have on the currency. Then the January US CPI print was stronger than expected, but the initial higher yield/USD positive reaction was overshadowed by a softer than expected retail sales report.
Later in the month the, AUD/USD began to drift lower again as the USD staged a recovery on the back of an upbeat economic assessment by new Fed Chair Jay Powell.
The AUD/USD spot rate spent the whole of February trading above our Short Term Fair Value (STFV) estimate. This is because of the influence of the VIX as our risk appetite proxy, which at its peak on February 6th pushed STFV down to as low as 0.74 and briefly outside of our +/-1.5 std. dev. fair value range. The subsequent fall-back in the VIX as US stock markets recovered their poise saw the gap between STFV and spot narrow, though by the end of the month spot was still trading about a cent above STFV (Chart 2).
Commodity prices had a somewhat volatile month, but overall were a mildly depressing influence on the model valuation largely due to falls in oil, gold and aluminium prices (the latter used as a proxy for the broader base metals complex, ex-iron ore which features separately). See Chart 3.
Interest rate differential also had a small negative impact on STFV, with stronger than expected US wages data early in the month lifting Fed tightening expectations while the Q4 Australian WPI and RBA rhetoric saw market pricing for 2018 RBA tightening ease back somewhat.
For more information download the attached
For further FX, Interest rate and Commodities information visit nab.com.au/nabfinancialmarkets

Long-term signal vs. Short-term noise
Insight


Join us as we discuss interest rates, general economic conditions, and the NAB AUD/USD forecast

Webinar
© National Australia Bank Limited. ABN 12 004 044 937 AFSL and Australian Credit Licence 230686.