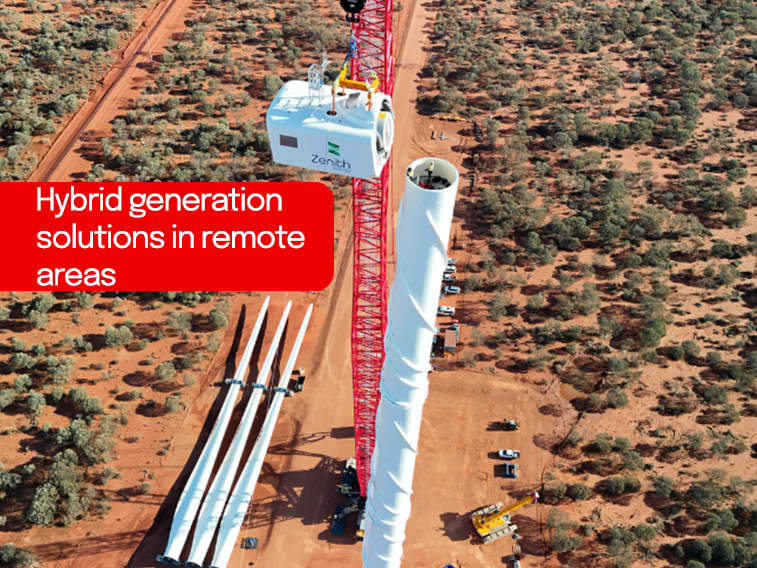
NAB client Zenith Energy’s innovation is helping decarbonise the mining sector through providing efficient hybrid generation solutions in remote areas.

June was another month of two halves for the AUD/USD.
The AUD in June 2019
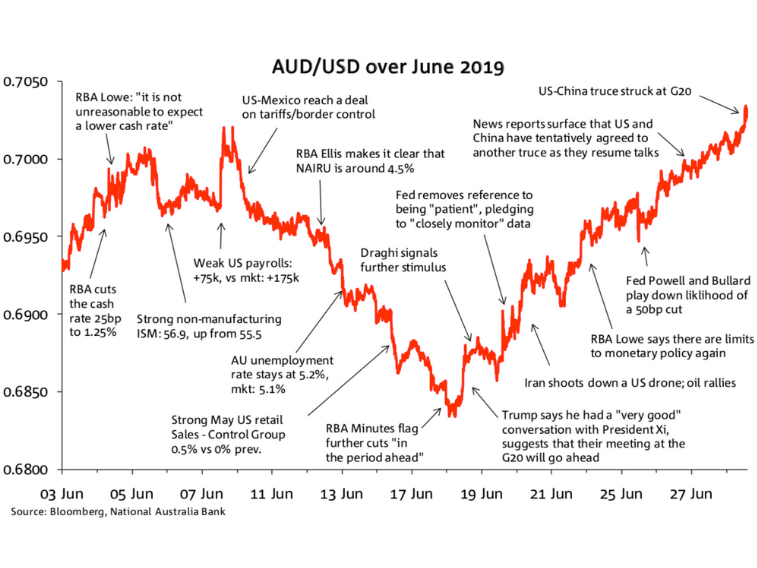
June was another month of two halves for the AUD/USD. In the first half the currency was under pressure from weak local data and a backdrop of heightened US-China trade tensions. These factors more than offset the support from an increasingly dovish Fed outlook and saw the AUD/USD reach a fresh low of 0.6834 on 18 June, the lowest level since January 2016. In the second half, an improving US-China trade outlook lifted the AUD/USD with higher iron ore, gold and oil prices also contributing factors. Late in the month, hopes of a US-China trade truce at the G20 meeting lifted the currency back above 70c and after trading in a range of 2 cents, the AUD/USD ended the month at 0.7021, two pips below its monthly high and 0.82c above its end of May level.
The AUD/USD began June at 0.6936, following new US trade threats against China, Mexico and India during the month of May. The AUD/USD was supported early on by USD weakness due to the ongoing US-Mexico dispute and a dovish Fed, while a 25bp cut to the cash rate by the RBA came and went with little impact. Then, news of a US-Mexico deal on 10 June saw the USD rally, and the AUD/USD fall to 0.6974. The currency trended lower over the next week on the back of strong US data releases and increasing fears the Trump administration would look to harden its line against China. This was exacerbated by weak local data releases lowering cash rate expectations culminating with the AUD/USD reaching its monthly low of 0.6834 on 18 June.
News that Trump had a “very good” conversation with President Xi saw a sharp rise in the AUD/USD on 18 June to 0.6876. Further reports that the US and China were willing to recommence negotiations saw the currency rise and break through the 70-cent ceiling. On the last trading day of the month, the AUD/USD reached its monthly high of 0.7023, before closing two pips lower and ahead of weekend news of a US-China trade truce at the G20 on 29 June.
The NAB AUD Model
Over the course of June the AUD/USD traded fairly close to our Short Term Fair Value (STFV) model estimate with a downward bias during the first half of the month and an upward bias in the second half. Based on our modelling the AUD/USD remains fairly priced, closing the month comfortably inside its fair value range (Chart 2).
The 0.89c rise in our AUD/USD STFV model estimate in June (vs the 0.82c lift in spot) was the product of positive contributions from all 3 major model components.
Commodities as a whole added 0.35c to the STFV model estimate with gold and oil the main positive contributors, partly offset by softness in coal prices. Risk sentiment, measured by the VIX index in our model, added 0.36c while the widening in the 1y AU-US OIS spread, on the back of aggressively dovish Fed pricing, contributed an extra 0.18c to the estimate (Chart 3).
For more information download the full report or the AUD/USD FY2018/19 chart.
For further FX, Interest rate and Commodities information visit nab.com.au/nabfinancialmarkets

NAB client Zenith Energy’s innovation is helping decarbonise the mining sector through providing efficient hybrid generation solutions in remote areas.

RBA surprises with a hold, NAB still sees cuts in August, November and now February

Insight
© National Australia Bank Limited. ABN 12 004 044 937 AFSL and Australian Credit Licence 230686.