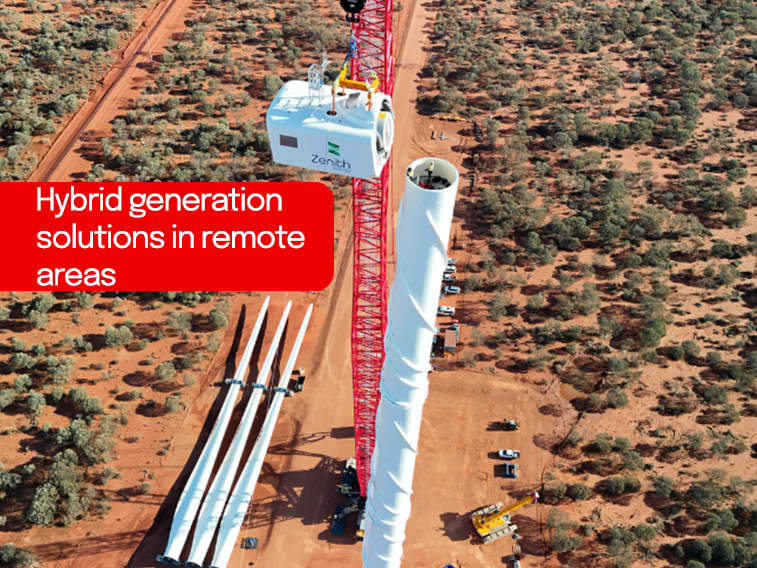
NAB client Zenith Energy’s innovation is helping decarbonise the mining sector through providing efficient hybrid generation solutions in remote areas.

The NAB Manufacturing Activity Index provides detailed analysis of activity in Australia’s manufacturing sector and has been constructed to replicate quarterly movements in activity within the sector. The Manufacturing Activity Index* eased further in Q2, remaining in negative territory – despite some divergent trends in individual sub-sectors. The index implies declines in quarter-on-quarter growth in […]

The NAB Manufacturing Activity Index provides detailed analysis of activity in Australia’s manufacturing sector and has been constructed to replicate quarterly movements in activity within the sector.
The Manufacturing Activity Index* eased further in Q2, remaining in negative territory – despite some divergent trends in individual sub-sectors. The index implies declines in quarter-on-quarter growth in the Manufacturing sector – which continues to be burdened by global uncertainty and the strong dollar
NAB’s Manufacturing Activity Index recorded further declines in the June quarter, down to -0.6 points (from -0.4 points in March). This implies further declines in manufacturing activity for this period – around -0.8% qoq.
ABS data for Industry Gross Value Added has recently been revised – which has significantly downgraded the industry growth of Manufacturing over the past two years. The revised series displays trends in industry growth which match far more closely to the Manufacturing Activity Index than in previous quarters.
Declines in the Activity Index were driven largely by declines in both Business Confidence and Final prices growth. Business confidence declined from around -3 points in Q1 to -5 points in Q2, a trend that was broadly in line with those of the broader economy. The largest declines in confidence were recorded in the Metal Products, Machinery & Equipment and Chemicals sectors.
Growth in final prices, a lagged measure in our index, softened in late 2011, following a sharp plunge in Q3. Prices for Manufacturers declined by -0.1%, compared with growth of around +0.2% for the broader economy. Printing, TCF and Chemicals saw the largest declines in growth (with each of these sectors reporting actual declines in prices).
The other components in the Activity Index – growth in Purchase costs and Labour costs – were relatively stable in our latest index.
Trends for individual manufacturing sub-sectors remain divergent. The Activity Indices for Food Products, Wood Products and TCF all gained in Q2, but the plunge in the index for Metal Products, combined with declines in Machinery & Equipment and Chemicals pushed the MAI lower.
For further analysis download the full report.

NAB client Zenith Energy’s innovation is helping decarbonise the mining sector through providing efficient hybrid generation solutions in remote areas.

RBA surprises with a hold, NAB still sees cuts in August, November and now February

Insight
© National Australia Bank Limited. ABN 12 004 044 937 AFSL and Australian Credit Licence 230686.