Conditions and Confidence improve for SMEs


NAB Online Retail Sales Index continued to grow in August, driven by department store sales and three key sales states, NSW, VIC, and QLD.
NAB Chief Economist, Alan Oster commented:
In month-on-month terms, our NAB Online Retail Sales Index continued to grow in August, accelerating in the month. Growth also accelerated when comparing this August to the same month 2020, i.e. in year-on-year terms. This indicates considerable strength in the index, given that the base of August 2020 had already grown over 65% on August 2019. Growth had trended lower in April and May this year, but has picked up again in the past four months, with a strong contribution from key online sectors. There are reports that, with a combination of increased volumes, and staff in isolation in distribution centres and delivery services, significant delays are emerging. Some suggest that this may impact sales growth in the near term. What we observed in 2020 was continued strong sales growth, despite pressures that emerged at that time. In the coming months this year we may even observe Christmas sales brought forward as supply constraints emerge.
Growth in monthly sales in August was driven by the three key sales states, NSW, VIC, and QLD, as well as rapid growth from ACT. While department store sales led category growth, in the locked down ACT, and NSW, personal and recreational goods grew more rapidly. Grocery and liquor in ACT was quite strong, even though this is one of the retail sectors still open to public. In year-on-year terms, growth for personal and recreational goods is being driven by NSW and ACT, with other states moderating after rapid growth for the same period in 2020. See this month’s heatmap for more detail.
Regional NSW led growth in the month, while metro VIC slightly outpaced metro NSW. In year-on-year terms, both regional and metro VIC growth has moderated to around 5%, but this is compared to a base period in 2020 where growth was up 81% and 130% respectively. For NSW metro, year-on-year growth is now up 74%, on top of growth for the same period 2020 of 51%.
In month-on-month growth terms, there were mixed results by location and merchant category. Overall, domestic merchants recorded strong growth across most categories, but were outpaced this month in the media, and grocery and liquor categories by international merchants, although the latter is a small share of the total for that category. However, in year-on-year terms, the key international categories, games and toys, and fashion, grew faster for domestic retailers.
Get all the insights in the NAB Online Retail Sales Index August 2021.

Conditions and Confidence improve for SMEs

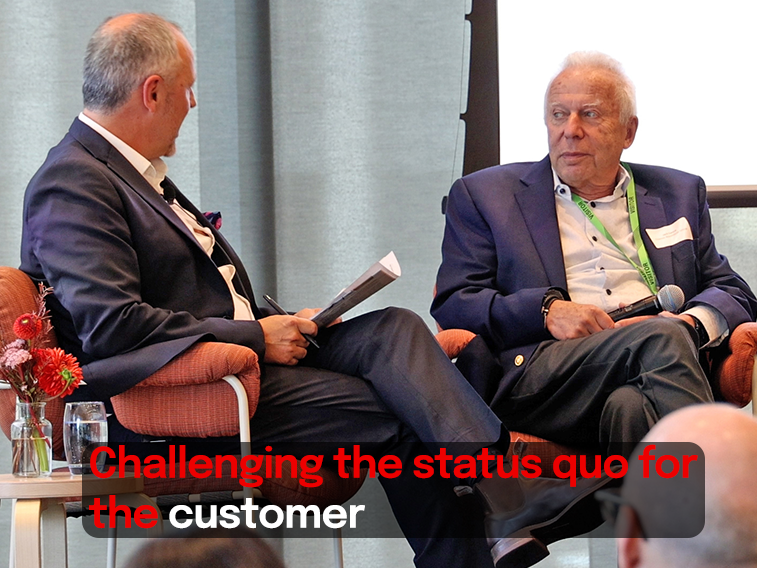
Creating cost-effective choices for consumers while forging business success is nothing new for Chemist Warehouse co-founder Jack Gance. As special guest at a recent NAB Transaction Banking event series, he looks at a new way to pay for businesses and customers.

Article
© National Australia Bank Limited. ABN 12 004 044 937 AFSL and Australian Credit Licence 230686.