Robust growth for online retail sales observed in June


Insight
Fed pauses as expected but ‘dot plot’ adds two, not one, more rate rises to 2023
The US Treasury yield curve has flattened out of the FOMC (2s +12bps, 10s little changed) while the USD is stronger post-FOMC, but on the day, still down on pre-Fed levels despite the all-round hawkish messaging accompanying the Fed’s widely expected rates pause. US equities have been left somewhat flat-footed, selling off initially on the 50bps lift to the median 2023 FOMC ‘dot’ against the 25bps expected, but subsequently clawing back losses to come into the close little changed on pre-Fed levels.
So, the hawkish surprise accompanying the as-expected Fed decision to hold the Funds rate target steady at 5.0-5.25% earlier this morning was the addition of 50bps to the median FOMC 2023 ‘dot’, the new plot showing only two current FOMC members seeing no need for any further rate rises this year. 9 of the 18 see the need for two more hikes, four for only one more and three for either three or four. The new 2024 dot plot sees the median lift by 25bps (to 4.50-4.75%) but this means three not two cuts in 2024 relative to the March plot and assumed emnd-2023 level of 5.50-5.75%. Hard to square with Fed chair Powell remark toward the end of the post-meeting press conference that we ‘are talking about a couple of years out’ for rate cuts. Furthermore, the new 2024 dot plot really is all over the map (ranging from 5.875% down to 3.625%). Meanwhile, July is a ‘live’ meeting, Powell opined.
Justifying the upward revisions to FOMC member dots relative to March, the Fed’s Summary of Economic Projections (SEP) shows core PCE inflation at 3.9% at end 2023 up from 3.3% previously, and only down to 2.6% in 2024 against 2.5% projected in March. GDP growth for 2023 is revised up to 1.0% from 0.4% and the unemployment rate to 4.1% compared to 4.5% in March. Worth noting that the new projections (including the dot plot) should be sen in the context of the fact the March meeting took place very shortly after the collapse of SVB and when fears of a major tightening in credit conditions were very much to the fore.
Heading into the FOMC, NAB’s US inflation view was just to the low side of the Fed’s March projections and are likely to remain so post-Fed. Somewhat helpful to the cause here, the latest US PPI data published in front of the Fed provided further evidence of building disinflationary forces. Headline PPI fell by 0.3%m below the -0.1% consensus, depressed by gasoline and food price falls. While the core reading rose by an as-expected 0.2%,this was very much led by margin expansion amongst retailers and wholesalers (gas station and auto- dealer margins in particular) which look to be more timing driven that any indication of the return of pricing power in these sectors. Core-PPI excluding trade services fell by 0.2% in May. Overall core PPI has fallen in twelve of the last thirteen months, from a peak of 9.7% last March to 2.8% in May.
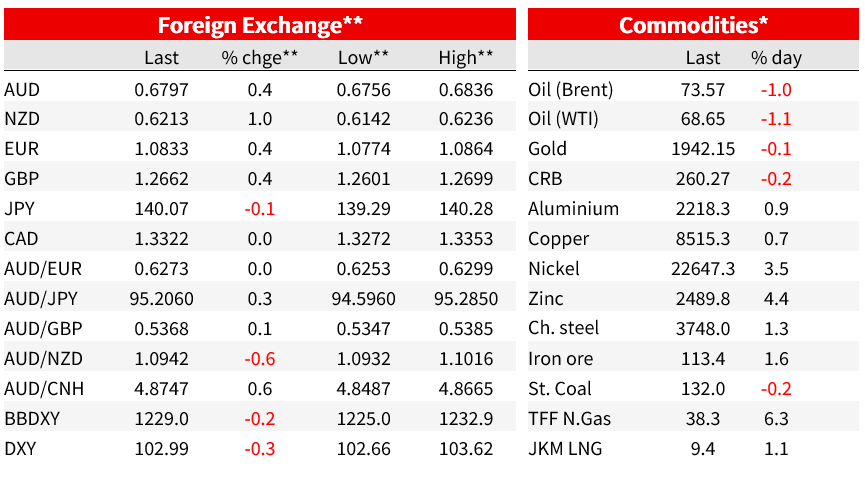
Outside of the Fed and incoming economic data, oil reman an important focus, with a further fall in WTI and Brent benchmark crudes of about 1% overnight. A contributing factor here appears to have been a WSJ report that the Biden administration has quietly restarted talks with Iran in a bid to win the release of American prisoners held by Tehran and curb the country’s growing nuclear program. The WSJ notes that as contacts between the two sides resumed, Washington also approved EUR2.5 billion, equivalent to $2.7 billion, in payments by the Iraqi government for Iranian electricity and gas imports, U.S. and Iraqi officials said. The money had been frozen by U.S. economic sanctions. This report come after reports last week – denied by White House officials – of progress in talks to revive the Iran nuclear pact and which could soon lead to some form of interim deal lifting the ban in Iranian oil exports.
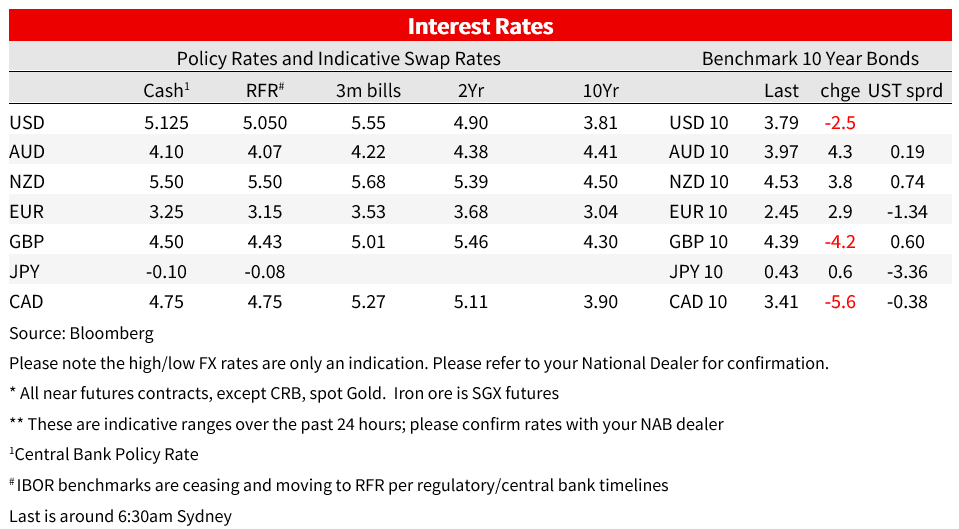
US money markets went into the Fed pricing a just under 60% change that rates would be 25bps higher by the July meeting. That pricing had risen but only slightly, to 62%. The roughly 25% chance markets ascribed to a first rate cut in January 2024 pre-Fed, has now been erased (precisely zero priced for the 31 January meeting). The bigger US interest rate market reaction has been in shorter dates (e.g. two year) Treasuries, initially jumping by as much as 19bps but currently up just 8bps on the day at 4.70%. 10s were up over 7bps by way of knee-jerk response to the Fed announcements but are currently just 2bps higher at just shy of 3.80%.
Currency markets have a fairly whippy last 24 hours, but squinting through the volatility, the Fed messaging has not been enough to interrupt the USD downtrend that has been evident since the start of June. The DXY is currently at 103.00 – so sitting on its 100-day moving average, down a third of a percent on the day and 1.6% off its 31 May high. A knee jerk 0.5% post-Fed rally has been cut in half in the last hour or so. Leading the charge up in currencies has been the NZD, up just over 1% in the last 24 hours and more than double the gains of any other G10 currency. No obvious reason for the strength, save that the kiwi did draw a little support first thing yesterday from significantly less bad than expected Q1 Current Account data (-8.5% of GDP against -9.0% expected).
AUD/USD has built on its modest local session gains and indeed spent a couple of hours above its March to date prior high of 0.6818 (high of 0.6836) but has slipped back post Fed to currently sit just beneath 0.68 (0.6896). CAD is a laggard given latest oil price weakness.
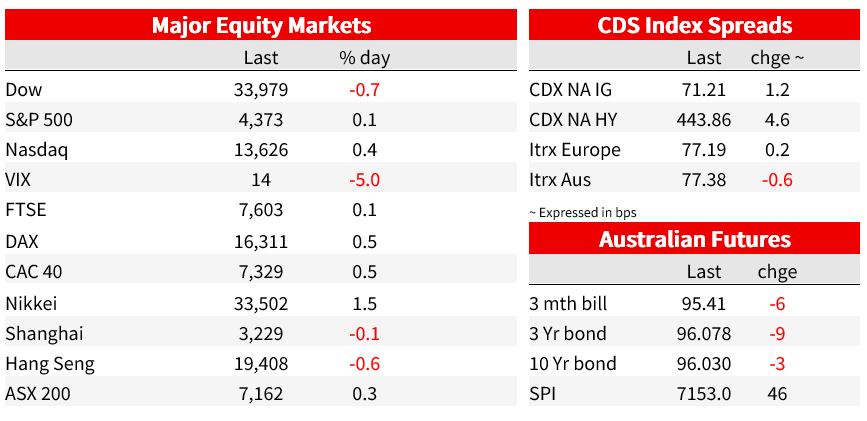
US equities have just ended Wednesday’s Wall Street day with the S&P500 little changed (+0.08%) and the NASDAQ +0.4%. Sector performance has been very mixed, e.g. IT up 1.14%, Health Care and Energy both -1.12%.
For further FX, Interest rate and Commodities information visit nab.com.au/nabfinancialmarkets. Read our NAB Markets Research disclaimer.

Robust growth for online retail sales observed in June
Insight


Coming in for landing in a heavy cross wind

Insight
© National Australia Bank Limited. ABN 12 004 044 937 AFSL and Australian Credit Licence 230686.