Long-term signal vs. Short-term noise


Insight
US CPI jumped in October with annual readings printing at new multi-decade highs, the broad base acceleration in prices challenges the transitory narrative and increases the pressure on a patient Fed.
https://soundcloud.com/user-291029717/eye-popping-inflation-doesnt-faze-the-fed?in=user-291029717/sets/the-morning-call
Too hot to handle? US CPI jumped in October with annual readings printing at new multi-decade highs, the broad base acceleration in prices challenges the transitory narrative and increases the pressure on a patient Fed. 5y UST yield have led the rise in nominal yields with a soft 30y auction adding another layer of volatility, more than reversing the initial flattening of the UST curve. US rates volatility spills over into other markets (2y Gilts jump 11bps 3y AU futures sell off 11bps) and the USD is broadly stronger with JPY and NOK leading the G10 declines, fall in oil prices not helping the latter. US equities gapped lower at the open and look set to end a second day in negative territory.
The market was expecting an acceleration in US inflation numbers, in the end however the increases were larger than expected with the headline and Core readings printing at new multi-decade highs. The headline October CPI rose 0.9%, well above the consensus, 0.6% while the core rose 0.6%, above the consensus, 0.4%. On a year on year basis US CPI is now at 6.2% while the core is at 4.6%, levels not seen since the early nineties. Details in the report revealed a broad-based rise in prices, challenging the notion that higher inflation is just a function of transitory factors . On top of the several specials from Q2 re-appearing (cars, holidays, etc) rents are trending higher and history shows that once rents get going the trend doesn’t reverse very quickly. Meanwhile labour costs are also rising. The broad base rise in price pressures was also evident by fresh highs for the Cleveland Fed median (3.1%), trimmed mean (4.1%) and Atlanta Fed sticky CPI (3.2%) measures, averaging 3.5%, about a 30-year high as well.
Supply constraints may well turn out to be transitory, but the rise in core drivers increases the pressure on the Fed to trigger a monetary policy response . The Fed’s resolve is facing a testing time, an increase in labour participation is needed to reduce upward pressure on wages while there is also a need for an increase in productivity. Doves within the Fed will point out that there are still over four million people in the US who lost their jobs through COVID who aren’t back in the workforce, but with plenty of jobs available, an increase in participation is urgently needed, otherwise the Fed will no longer be able to ignore its price stability mandate.
Fed Daly, a known dove, spoke to Bloomberg TV early this morning and said she is monitoring “eye-popping” inflation, but it is too soon to judge if the central bank should accelerate its pace of policy tightening. Adding “Right now, uncertainty requires us to wait and watch with vigilance.”.
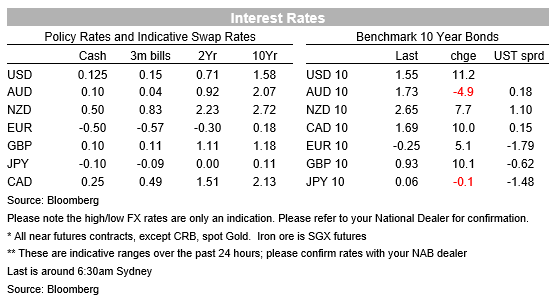
The UST market delivered a robust reaction to the inflation data with US rates volatility also spilling over into other The 5y part of the curve led the rise in nominal yields, up over 11bps to 1.1948%, initially flattening the curve as the back end lagged the move markets.. But then just to make things more interesting, the 30y bond auction was met with extremely low demand, tailing 5.2bs and stopping at 1.94% (now at 1.91.4%). Both indirect (59%) and direct (15.8%) bidders show little appetite to buy the bond, leaving dealers holding the bag with just over a quarter of the sale. Bloomberg noted this was 1.8 sigma more than usual. Thus, after an initial flattening of around 4bps the 2y 10y UST curve is now around 2bps steeper on the day at 105bps with a similar price action also evident in the 5y30y curve. 10y UST now trade at 1.55% with both breakevens ( +5bps to 2.6997%) and real yields ( +2bps to -1.17%) higheron the day
Core global yields also had a volatile session with 2y Gilts leading the moves up 12bps to 0.552% while the 10y rate gained 10bps to 0.919%. Other core European 10-year rates close up in the order of 5-10bps. AU 3-year bond future sold off 13bps after the US CPI release while the 10-year future sold off 10bps.
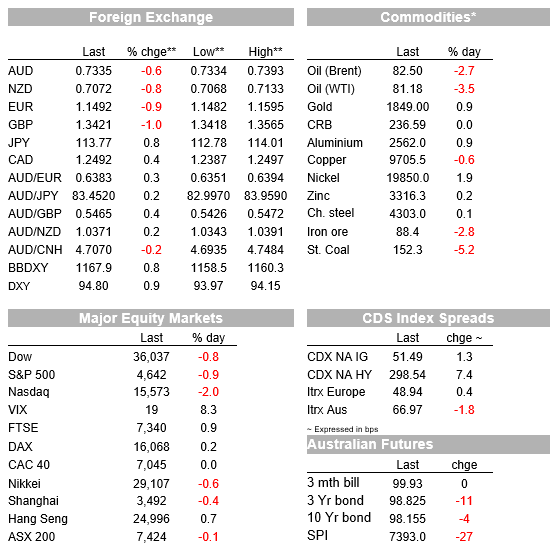
Moving onto FX, the combo of higher UST yields and market volatility has favoured the USD with the DXY and BBDXY indices gaining around 0.7% over the past 24 hours. Both indices now trade at new YTD highs . DXY is approaching the 95 level at 94.84. The drastic move up in UST yields triggered a big reversal in USD/JPY, in recent days the yen was on the ascendency with USD/JPY breaking through the bottom of recent range, trading to a low of 112.72 late during our session yesterday. But after the CPI US rates reaction, USD/JPY is back on its old range and trading at ¥113.82. NOK is the other big G10 underperformer, down 1.40% and not helped by the fall in oil prices (Brent -2.12% and WT -2.90%). Oil’s losses accelerated amid a stronger dollar and after a U.S. government report showed a surprise increase in domestic crude stockpiles. US crude inventories increased for a third straight week to the highest since August, according to an Energy Information Administration report.
The euro (-0.71% and now at 1.1486) and GBP (-0.75% and now at 1.3413) are around the middle of the pack flanked by NZD, down 0.75%at 0.7064 and the AUD , down 0.4% to 0.7332. AUD resilience is notable given the broad risk aversion in the air and decrease in energy prices with iron ore also under pressure, down another 3% and now trading at $88.4. For now, the USD looks to be in the driving seat while the technical picture also suggest the AUD has room to trade lower.
US equity indices opened lower reacting to the US CPI figures and UST moves. After a feeble attempt to move back into positive territory, the S&P 500 looks set to end a second day with negative returns, currently down 0.89% while the NASDAQ is -1.60% ad the Dow is -0.60%.
Read our NAB Markets Research disclaimer
For further FX, Interest rate and Commodities information visit nab.com.au/nabfinancialmarkets

Long-term signal vs. Short-term noise
Insight


Join us as we discuss interest rates, general economic conditions, and the NAB AUD/USD forecast

Webinar
© National Australia Bank Limited. ABN 12 004 044 937 AFSL and Australian Credit Licence 230686.