A private sector improvement to support growth

Insight
A higher-than-expected US PPI print contributed to higher yields, while equities ended the week on a muted note.
Manufacturing PMI, Jul: 46.3 vs. 47.5 prev.
NZ: Food prices (m/m%), Jul: -0.5 vs. 1.6 prev.
UK: Industrial production (m/m%), Jun: 1.8 vs. 0.2 exp.
UK: GDP (q/q%), Q2: 0.2 vs. 0.0 exp.
US: PPI final demand (y/y%), Jul: 0.8 vs 0.7 exp.
US: PPI ex food and energy (y/y%), Jul: 2.4 vs. 2.3 exp.
US: U. of Mich. consumer sent, Aug: 71.2 vs 71.3 exp.
US: U. of Mich. 5-10 yr inflation exp, Aug: 2.9 vs. 3.0 exp.
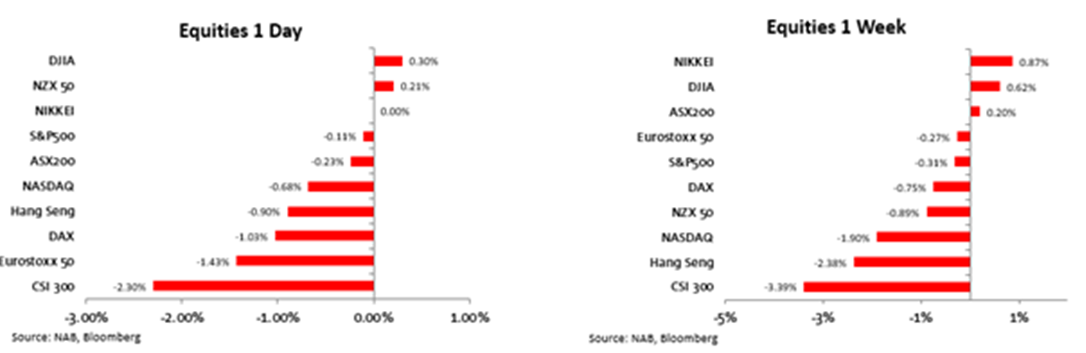
A higher-than-expected US PPI print contributed to higher yields, while equities ended the week on a muted note. In the US, the S&P was marginally down, while the Nasdaq fell 0.7% to a 1-month low. Those two US indices, plus the MSCI World Index, each lost ground for a second consecutive week. The MSCI world index is now 4% below the highs from late July.
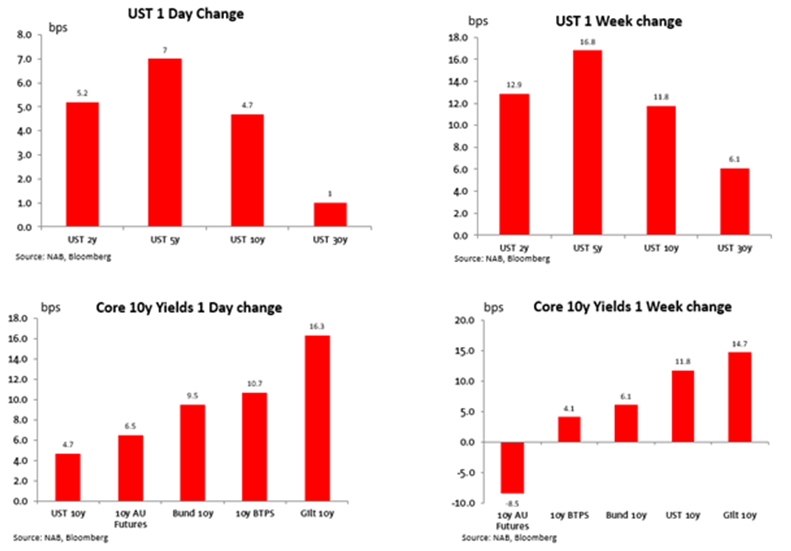
PPI was up 0.3% m/m (0.2% expected), as was the core reading. The higher-than-consensus PPI print contrasted the second month of unambiguously good news in the CPI released earlier in the week and 2yr yields jumped on the outcome, up around 10bp to 4.91% immediately after the release. University of Michigan consumer sentiment, a couple of hours later, knocked them a few bps lower, before trading around 4.89% over the final few hours of trading for the week. US yields were higher across the curve over the week, the 2yr up 13bp to 4.89% and the 10yr up 12bp to 4.15%, but leaving both about 5bp shy of their levels before the payrolls-induced rally into the close of prior to week.
The monthly gain in the core PPI was the largest since November last year. Trade services, which reflect retail and wholesaler margins, rose in the month but at still elevated levels are likely to resume their recent downtrend, while spare capacity in the Chinese manufactured exports should keep downward pressure on goods prices. A downward revision to the previous month also didn’t flatter the July outcome. Nonetheless, with the market increasingly confident of a soft landing, the upside surprise does highlight sensitivity to the risk of reacceleration so long as labour markets remain tight and demand remains resilient. As for the consumer sentiment, the headline index dipped from 71.6 to 71.2 (consensus 71.0). The closely watched 5-10yr inflation expectation dipped to 2.9% from 3.0% data.
Elsewhere, UK GDP grew 0.2% q/q, higher than the 0.0% expected. The June monthly outcome was 0.5% m/m (0.0% expected). There were upside surprises across household and government consumption and investment in the quarter. Yields were 13-16bps higher across the UK gilt curve with 10-year bonds ending the week at 4.52%.
Locally on Friday, RBA governor Lowe appeared before the House Standing Economics Committee for the last time, though he still has one RBA Board Meeting left in September. There is little to be gleaned from his remarks beyond the recent SoMP; a tightening bias remains, but the RBA is hoping it has done enough. The reason for pausing in July and August was to “provide time to assess the impact of the increases to date and the economic outlook and associated risks”. Lowe termed this as the “calibration phrase” and he hopes “we’re kind of in a world where we’re just making, I hope, small adjustments to calibrate policy.” Not too much to trouble market pricing then, but the chance of further tightening from here was firmed at the margin to around two thirds chance of another hike by early next year. The yield implied on aussie 3yr futures was 4bp higher on Friday to 3.86%, with much of that alongside the US move after PPI.
US equities were little changed on Friday. Shares opened modestly lower after the upside PPI surprise, but the S&P500 was down just 0.1% over the day. That was enough to see the index 0.3% lower over the week, only slightly negative but what is its second consecutive week in the red. IT was the underperformer on Friday, down 0.9%, while energy stocks were 1.6% higher. The Nasdaq was 0.7% lower on Friday to be 1.9% lower over the week. Nvidia, the S&P 500’s top performer this year, fell 3.6% Friday, for its fourth consecutive daily loss. The EuroStoxx 50 was 1.4% lower on Friday to be 0.3% down over the week.
Concern surrounding the outlook for the Chinese economy has seen Chinese shares the underperformers over the week. The CSI 300 lost 2.3% on Friday to be 3.4% lower over the week. Aggregate financing figures released late Friday missed estimates. New yuan loans were 346bn against 780bn expected, the smallest since July 2009. In y/y terms, bank loan growth is at its slowest since the start of the year, weighed by lending to both corporates and to households (amid weak mortgage demand). Monthly activity data for July are released Tuesday. Getting some attention earlier on Friday was news that China will allow provincial-level governments to raise about 1 trillion yuan ($139 billion) via bond sales to repay the debt of local-government financing vehicles and other off-balance sheet issuers.
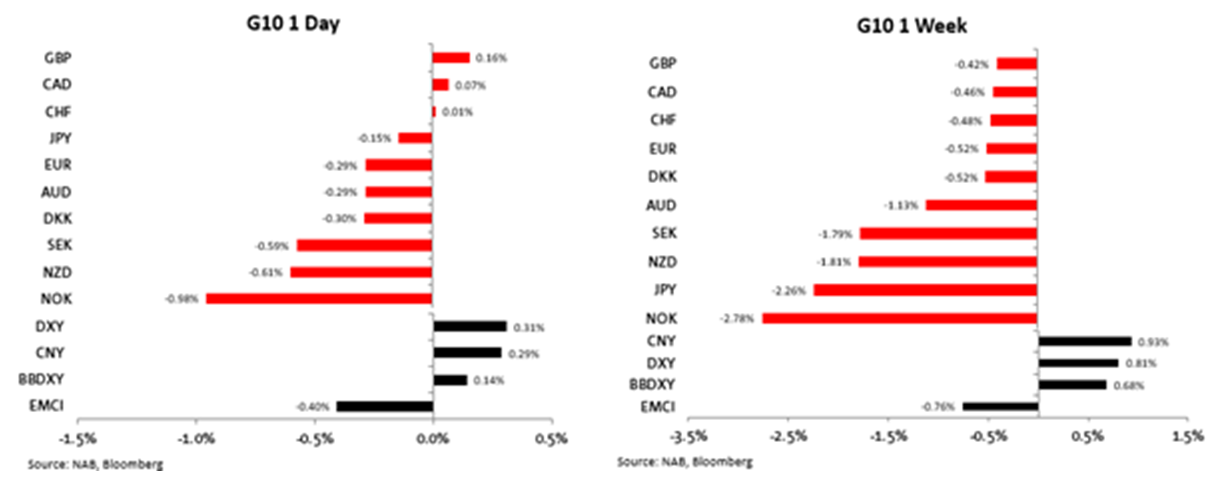
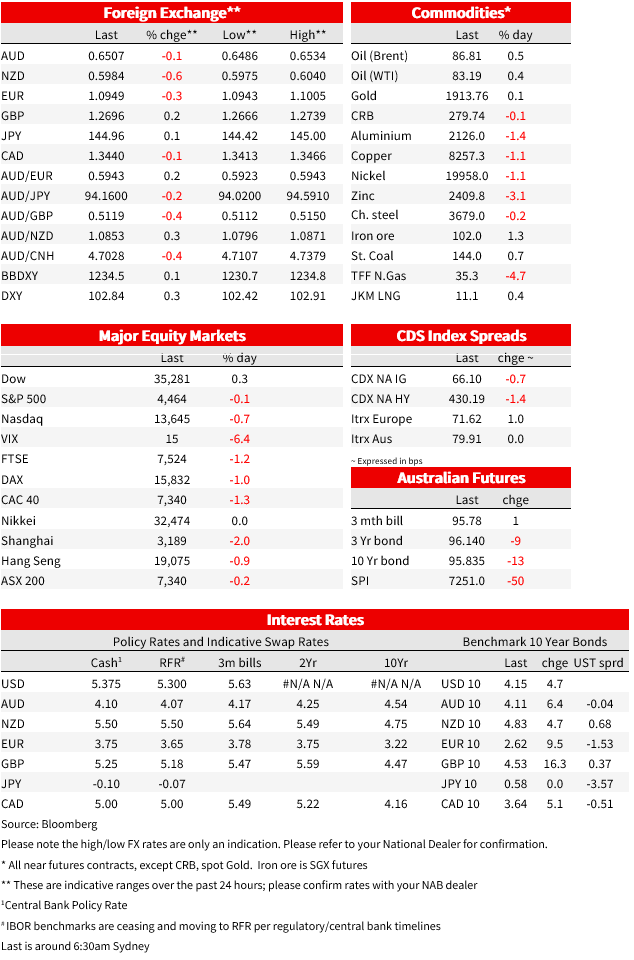
The US dollar was stronger, up 0.3% on Friday on the DXY with a leg higher coming on the back of the PPI data. The DXY was 0.8% higher over the week to 102.84, back around its highest level since early July. The yen was one to worst performers among G10 currencies, losing 2.3% over the week. The USDJPY approached vanishingly close to 145 on Friday before ending the week at 149.96. It was around 145.07 that authorities first intervened in the market late last year. The Norwegian Krone was the weakest G10 currency following below consensus inflation data.
The AUD lost 0.3% on Friday and 1.1% over the week, around the middle of the G10 pack against the stronger dollar, and outperforming the kiwi, which lost 1.8% over the week. The AUD dipped below 65c on Friday to a low of 0.6486 before ending the week at 0.6496. The combination of a stronger dollar and a weaker renminbi are not helping the cause for the aussie. The CNY lost 0.9% against the USD over the last week to around 7.24, its highest since 10 July. NZD/USD slipped below 0.6000 on Friday evening and made marginal new lows for the year near 0.5980.
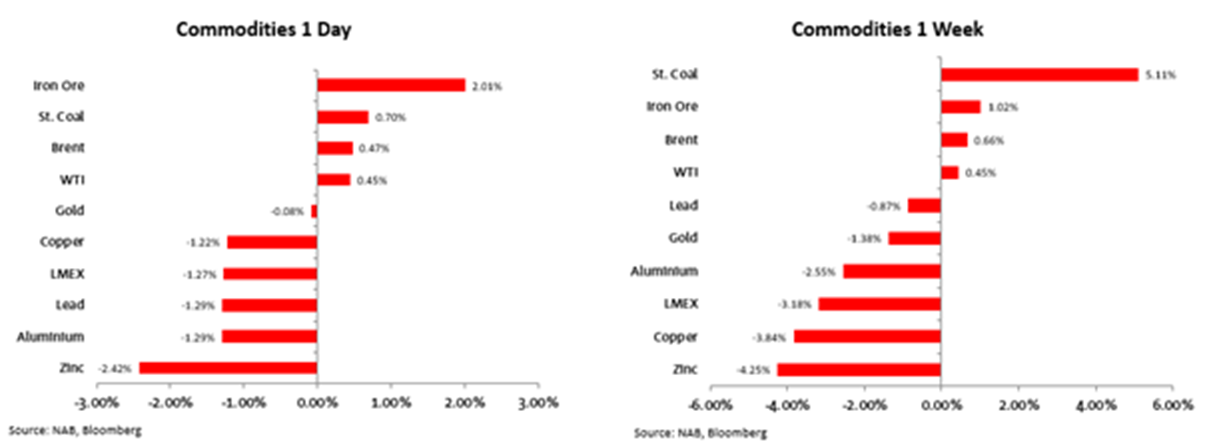
Oil managed small gains over the week, up around half a percent on both WTI and Brent. WTI has seen seven consecutive weeks of gains, the longest stretch since June 2022. A monthly IEA report on Friday said that world oil demand surged to a record in June, while an OPEC monthly report on Thursday forecast markets will experience a sharp supply deficit of more than 2 million barrels a day this quarter.
Iron ore was stronger on Friday to be up 1% over the week despite ongoing concerns about the Chinese growth outlook with reports citing some Chinese steel mills recommencing operation after the summer break as one support.
Today
This Week
Market Prices
For further FX, Interest rate and Commodities information visit nab.com.au/nabfinancialmarkets. Read our NAB Markets Research disclaimer.

A private sector improvement to support growth
Insight


Online retail sales growth accelerated 1.1% in April

Insight
© National Australia Bank Limited. ABN 12 004 044 937 AFSL and Australian Credit Licence 230686.