Online retail sales growth slowed in May following a fairly strong April


Insight
US equities continue to race upwards, at or near record highs.
US stocks have closed with new record highs for the S&P 500 (+1.4%) alongside which the recent underperformance of technology stocks relative to small caps and cyclicals has reversed, the NASDAQ the night’s best performing US index (+2.1%) with the Dow up a lesser 1% and the Russell 2000 just 0.4%.
Tentative signs of a bending of the COVID-19 infection curve in the United States is one pretext, daily new infections below 50,000 for the third consecutive day (against which in Europe, France, Germany and Spainare experiencing resurgence in infections). Second, vaccine hopes spring eternal, albeit scientists have been quick to pan the suggestion that two months is anywhere near enough to deem a vaccine trial successful, apropos yesterday’s Russian news that a large scale roll-out of one of its vaccines had been approved. And third, optimism persists it seems with respect to early agreement on a new US fiscal support package, despite a complete lack of evidence of movement in this direction (though in the last few minutes it’s reported Mnuchin and Pelosi have at least spoken today).
Headline printing twice what was excepted at 0.6% m/m and the core three times bigger than forecast, also 0.6%. Headline CPI is back up to 1.0% from 0.6% (0.7% expected0 and core 1.6% from 1.2% (1.1% expected). Used car prices, apparel (clothes to you and I) and air fares accounted for much of the upside surprise. The former might be explained by supply chain disruptions impacting new car availability, apparel by the weaker dollar and airfares by the increase in demand for (domestic) travel, all of which may prove temporary.
In particular, break even inflation rates (inflation expectations) lifted by some 3.5 bps, more than the 1.5bp rise in nominal yields and so reversing some of the recent back-up in US real yields and which is one of the reasons why the US dollar has performed slightly better in recent days. The USD was back down today, albeit this is likely as much about the strength of risk sentiment as other factors. The BBDXY index -0.3%, led by a 0.4% rise in EUR/USD back to just shy of 1.18. Bond yields dip slip back into and out of the 10-year Note auction, which cleared 0.4bp through its (1pm) when-issued yield, but moved back up into the NYSE close as equities held their poise.
Along with GBP (-0.2%) and JPY (-0.3%) the NZD has been an underperformer in the last 24 hours following yesterday’s RBNZ surprise to the dovish side in its latest policy pronouncement, increasing the Large Scale Asset Purchase (LSAP) programme to $100bn through June 2022 from $60b through June 2021. In looking at ways to further ease monetary policy in the future, negative rates are cited as next cab off the rank, but if so not before next year, the RBNZ maintaining the 25bps OCR commitment at least through March 2021.
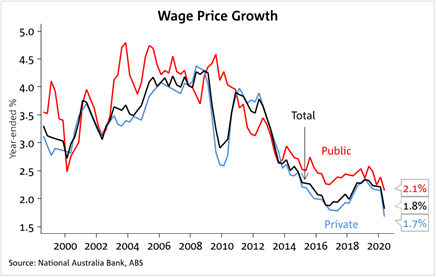
AUD was dragged lower alongside NZD post RBNZ, and also suffered a little after the Q2 wages data, but the improvement in risk sentiment has carried the day to see AUD/USD 0.3% up in the last 24 hours to 0.7164 as I type. The Wage Price Index (WPI) rose just 0.2% q/q in June, one tenth weaker than the 0.3% consensus. Annual wages growth is now 1.8% y/y, the lowest recorded annual rate in the 22-year history of the index (See Chart of the Day below). Private sector wages were slightly weaker, up just 0.1% q/q, while public sector wages were stronger at +0.6% q/q. In non-seasonally adjusted terms private sector wages actually fell -0.1% q/q. The outlook for wages growth is very weak with the RBA’s latest forecasts seeing annual wages growth slowing to 1¼% in 2021, well below the post-inflation targeting average of 3.2% annual wages growth and weak wages growth will weigh on inflation outcomes for some years.
Or in the case of UK GDP lowlight, was confirmation that the UK economy shrank by more than 20% in the second quarter (-20.4%), more than any other major economy and symptomatic of the UK’s very high service sector concentration (circa 80%). On the positive side, the June monthly GDP estimate came in at +8.7%, above the 8.0% expected with May revised up to 2.4%, confirming that the worse was over in the UK economy back in April. Eurozone industrial production for June came in at 9.1% m/m, below the 10.0% expected.
China July credit and money supply numbers were published after Australia closed for the day and were mildly disappointing. Aggregate Social Financing grew by ¥1.69tn down sharply from 3.43tn in June and below the 1.85tn expected. M2 money supply growth slipped slightly, to 10.7% from 11.1% and below the 11.2% expected. At face value, this reduces the chances of upside surprises in tomorrow’s July activity data.
Gold staged a near 5% recovery off its late Australian day low (to $1,950 from $1,863) but has fallen away somewhat into the NY close ($1,917 now). Renewed slippage in the USD and real US yields look relevant here. Oil has had another good, day, WTI crude closing in New York up almost $1 at $42.56, its best since May 3.
For further FX, Interest rate and Commodities information visit nab.com.au/nabfinancialmarkets

Online retail sales growth slowed in May following a fairly strong April
Insight


Long-term signal vs. Short-term noise

Insight
© National Australia Bank Limited. ABN 12 004 044 937 AFSL and Australian Credit Licence 230686.